Robert Monfera
bl.ocks
linkedin
github
stackoverflow
email
native, reactive viz with SwiftUI and Metal
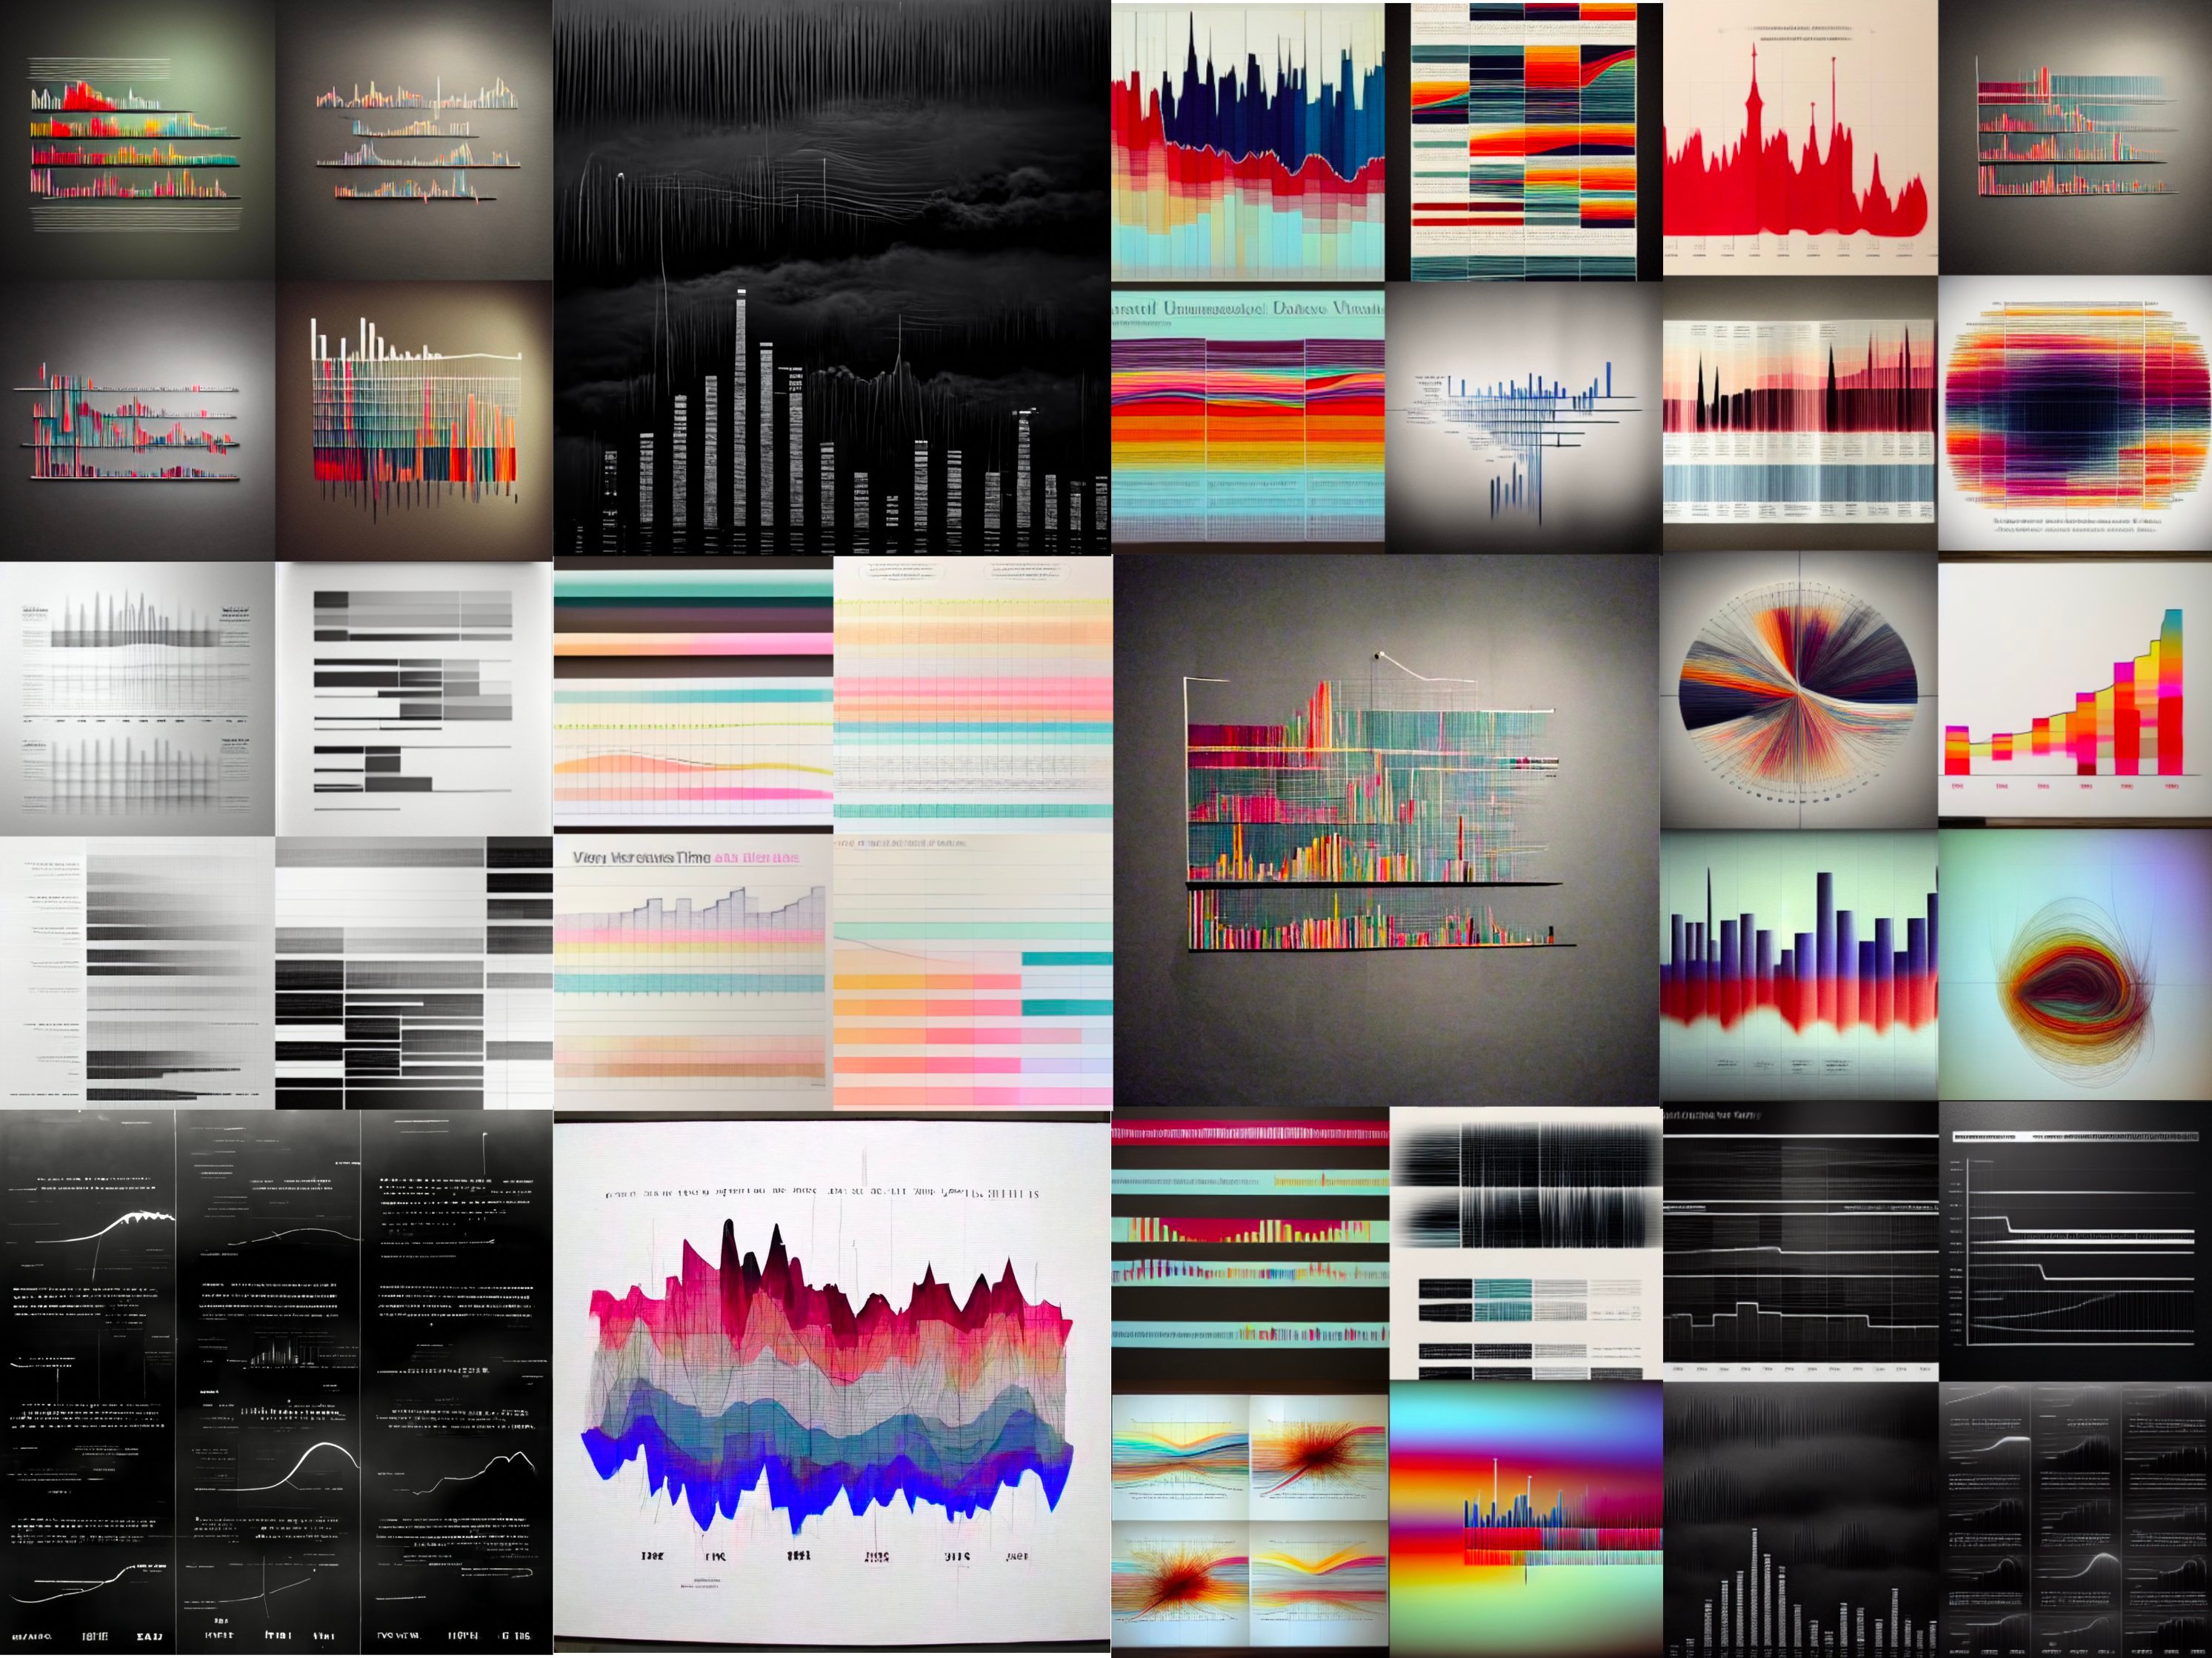
mid-2022 midjourney dataviz
webgpu minimal examples [WIP]
sequential monte carlo filter localization [WIP]
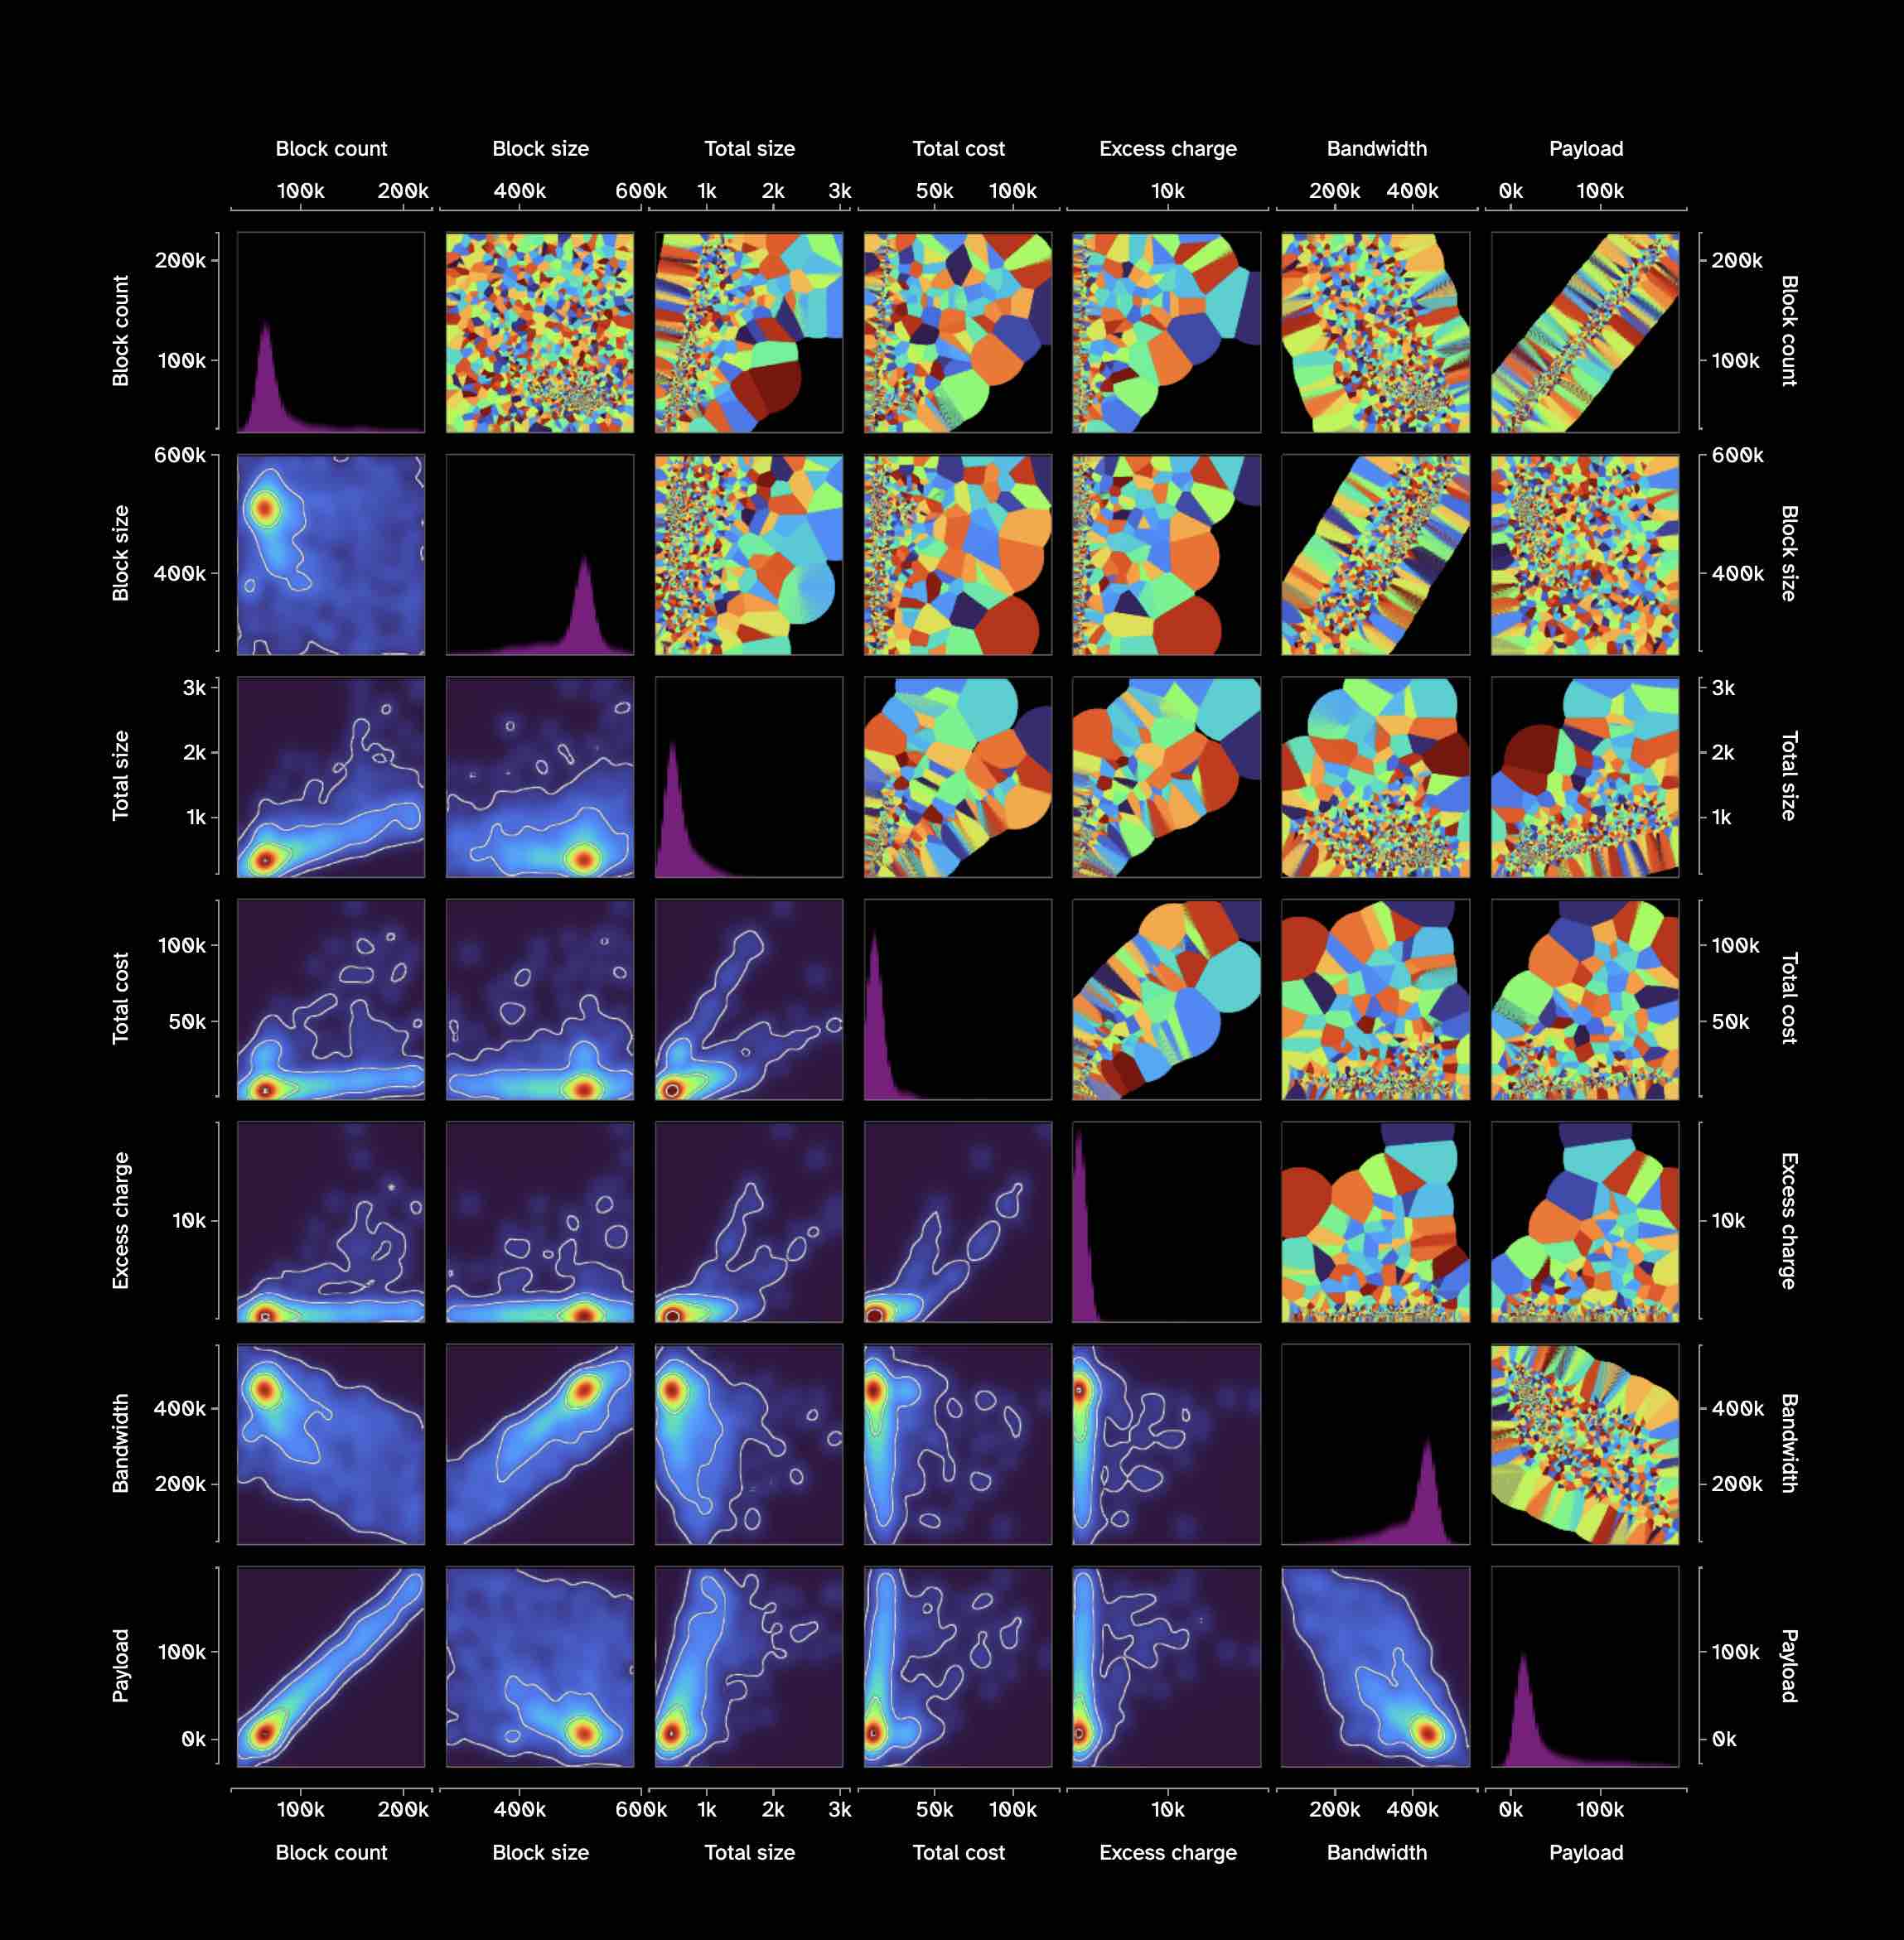
webgl-computed density/contour, voronoi point pick layer for SPLOM
squarifying treemap/mosaic from scratch
scatterplot markers with shader math
sunburst with constructive plane geometry based text fitting
mobile charting with direct manipulation
[audio] voiceover and sonification for accessibility
chart layering prototypes
WebGL2 flame chart
timeslip time series zoom/pan prototype
Plotly parcoords with crossfiltering inside webgl
pixelated plots (twitter channel)
waffle chart
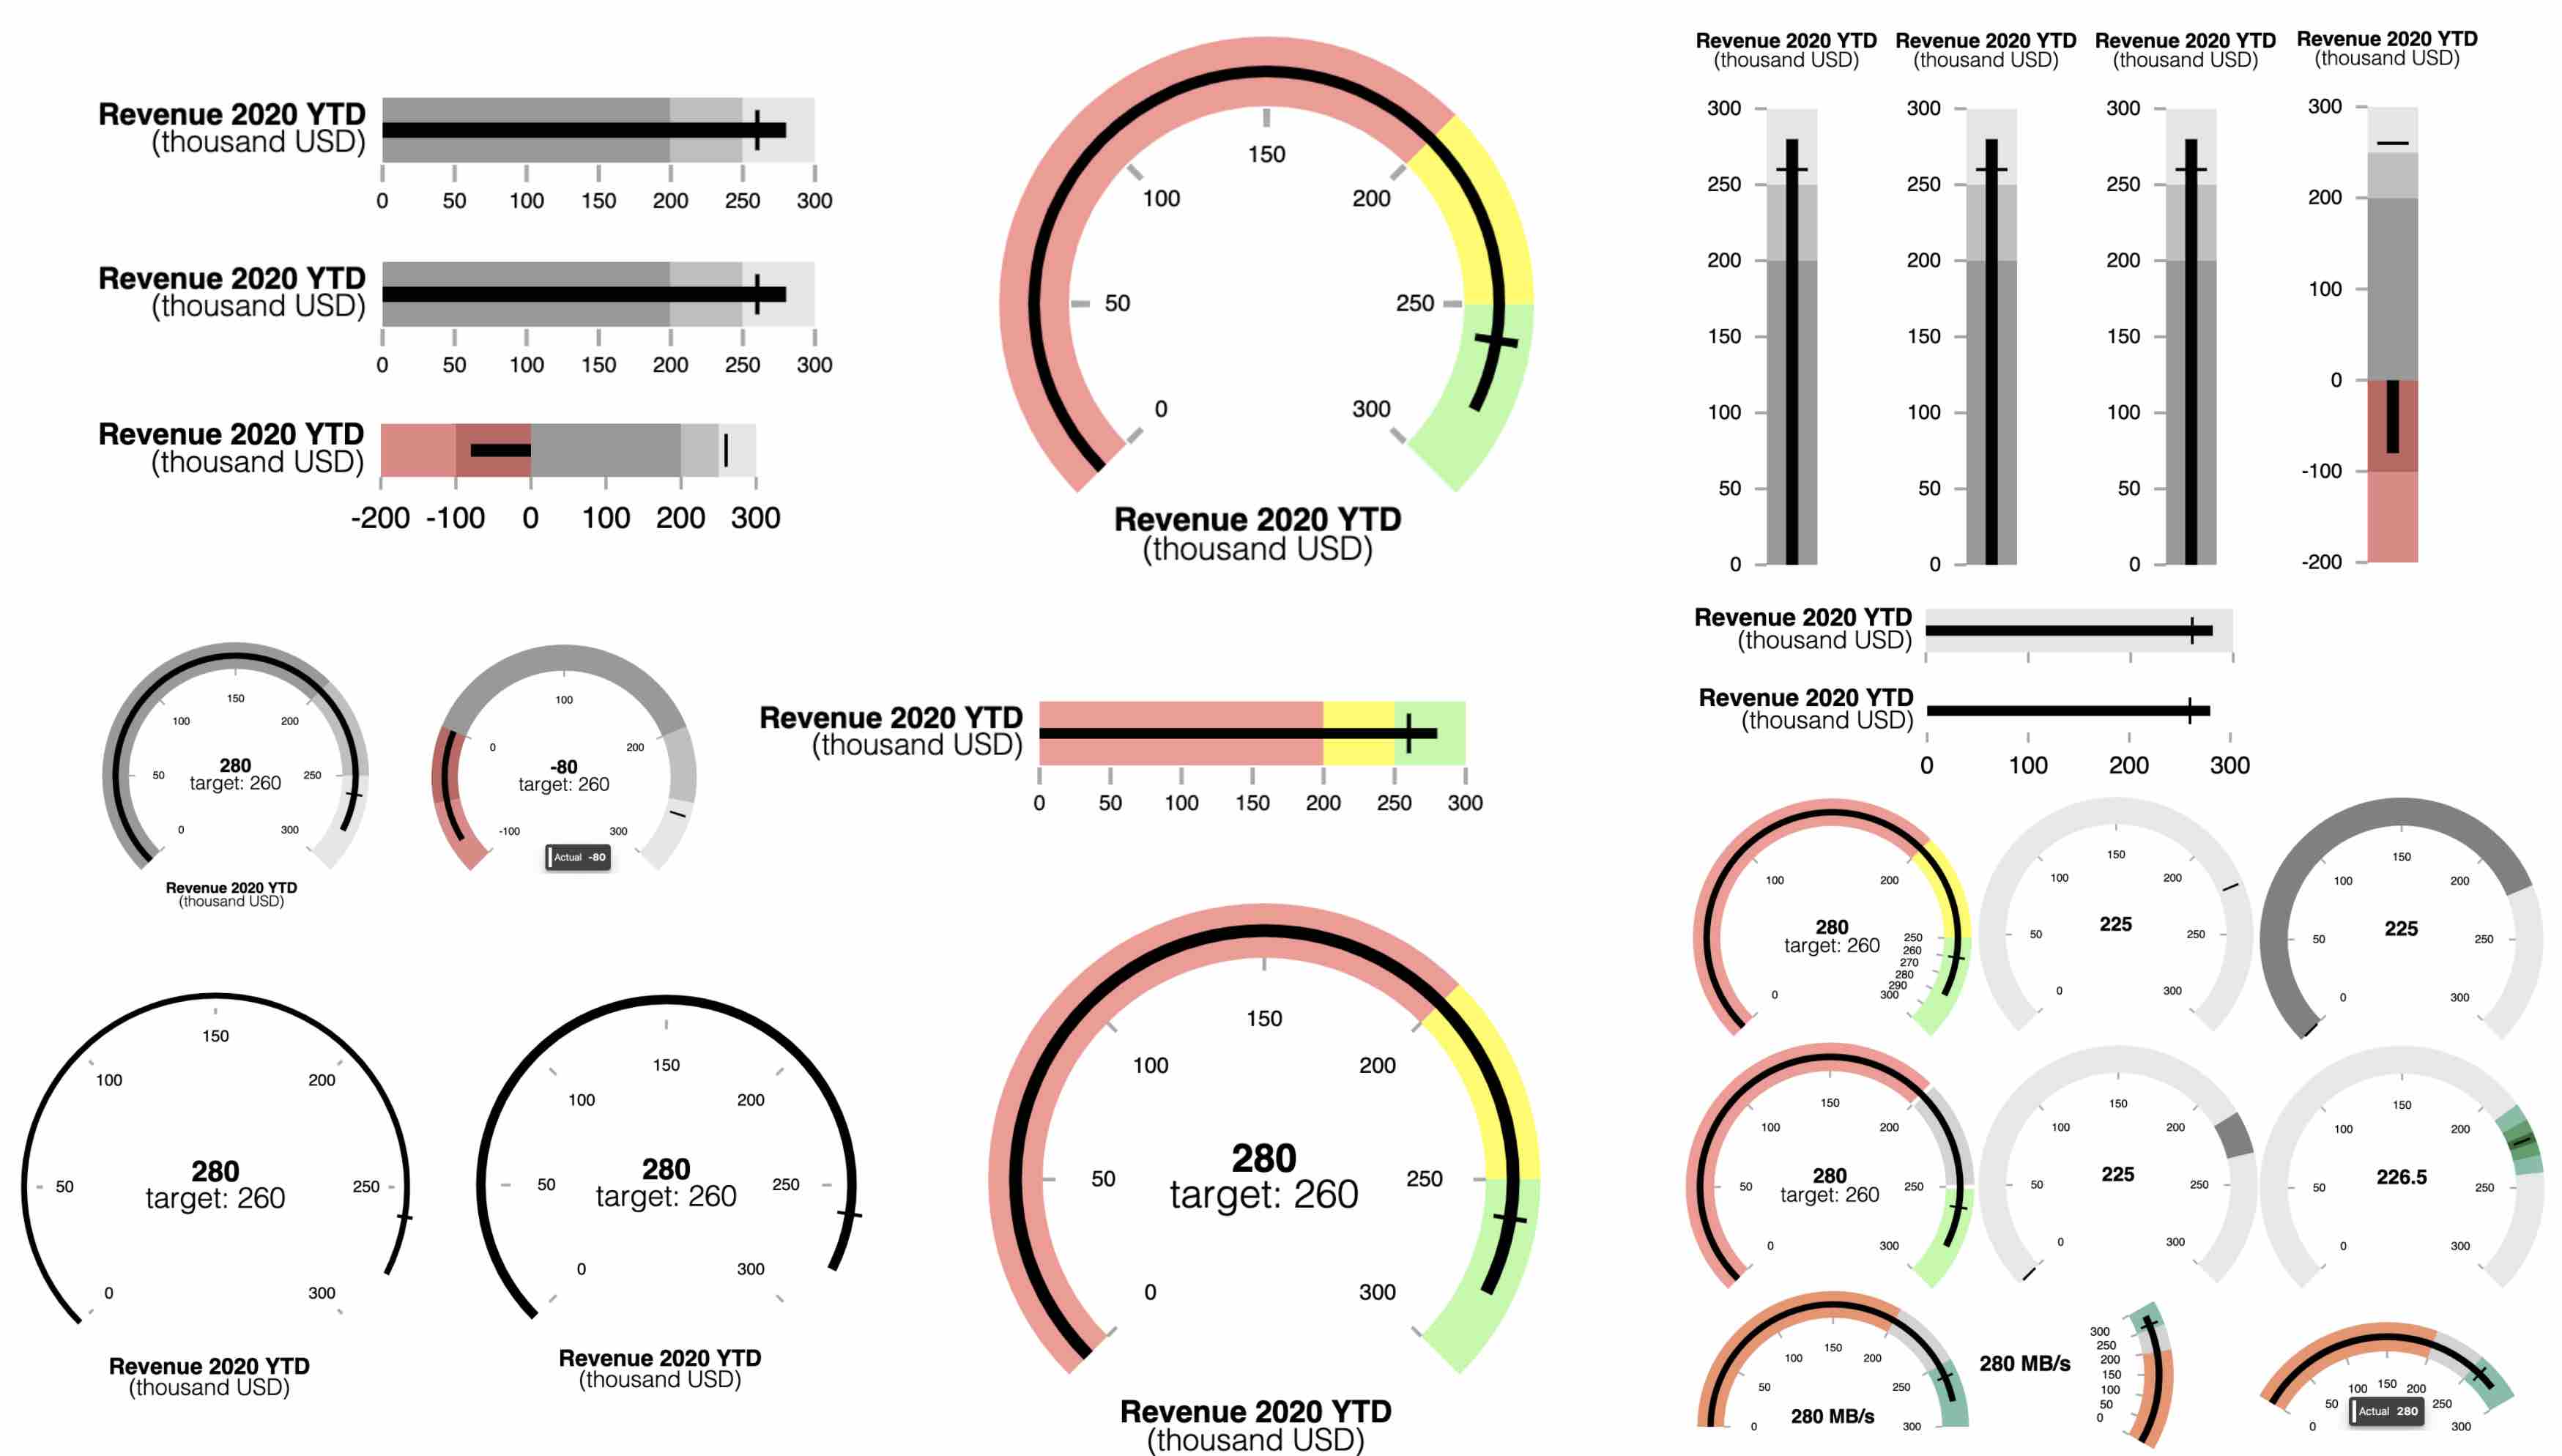
bullet graphs
marimekko / mosaic plot
responsive, multilayer time axis
gauges
responsive small multiples (partitions)
book draft review for crc press
word cloud with d3-cloud - collab with my sister
D3 tweet-size animations
student dashboard implementation
morphing dashboard
guest lecturer, ba finance, ibs oxford brookes budapest
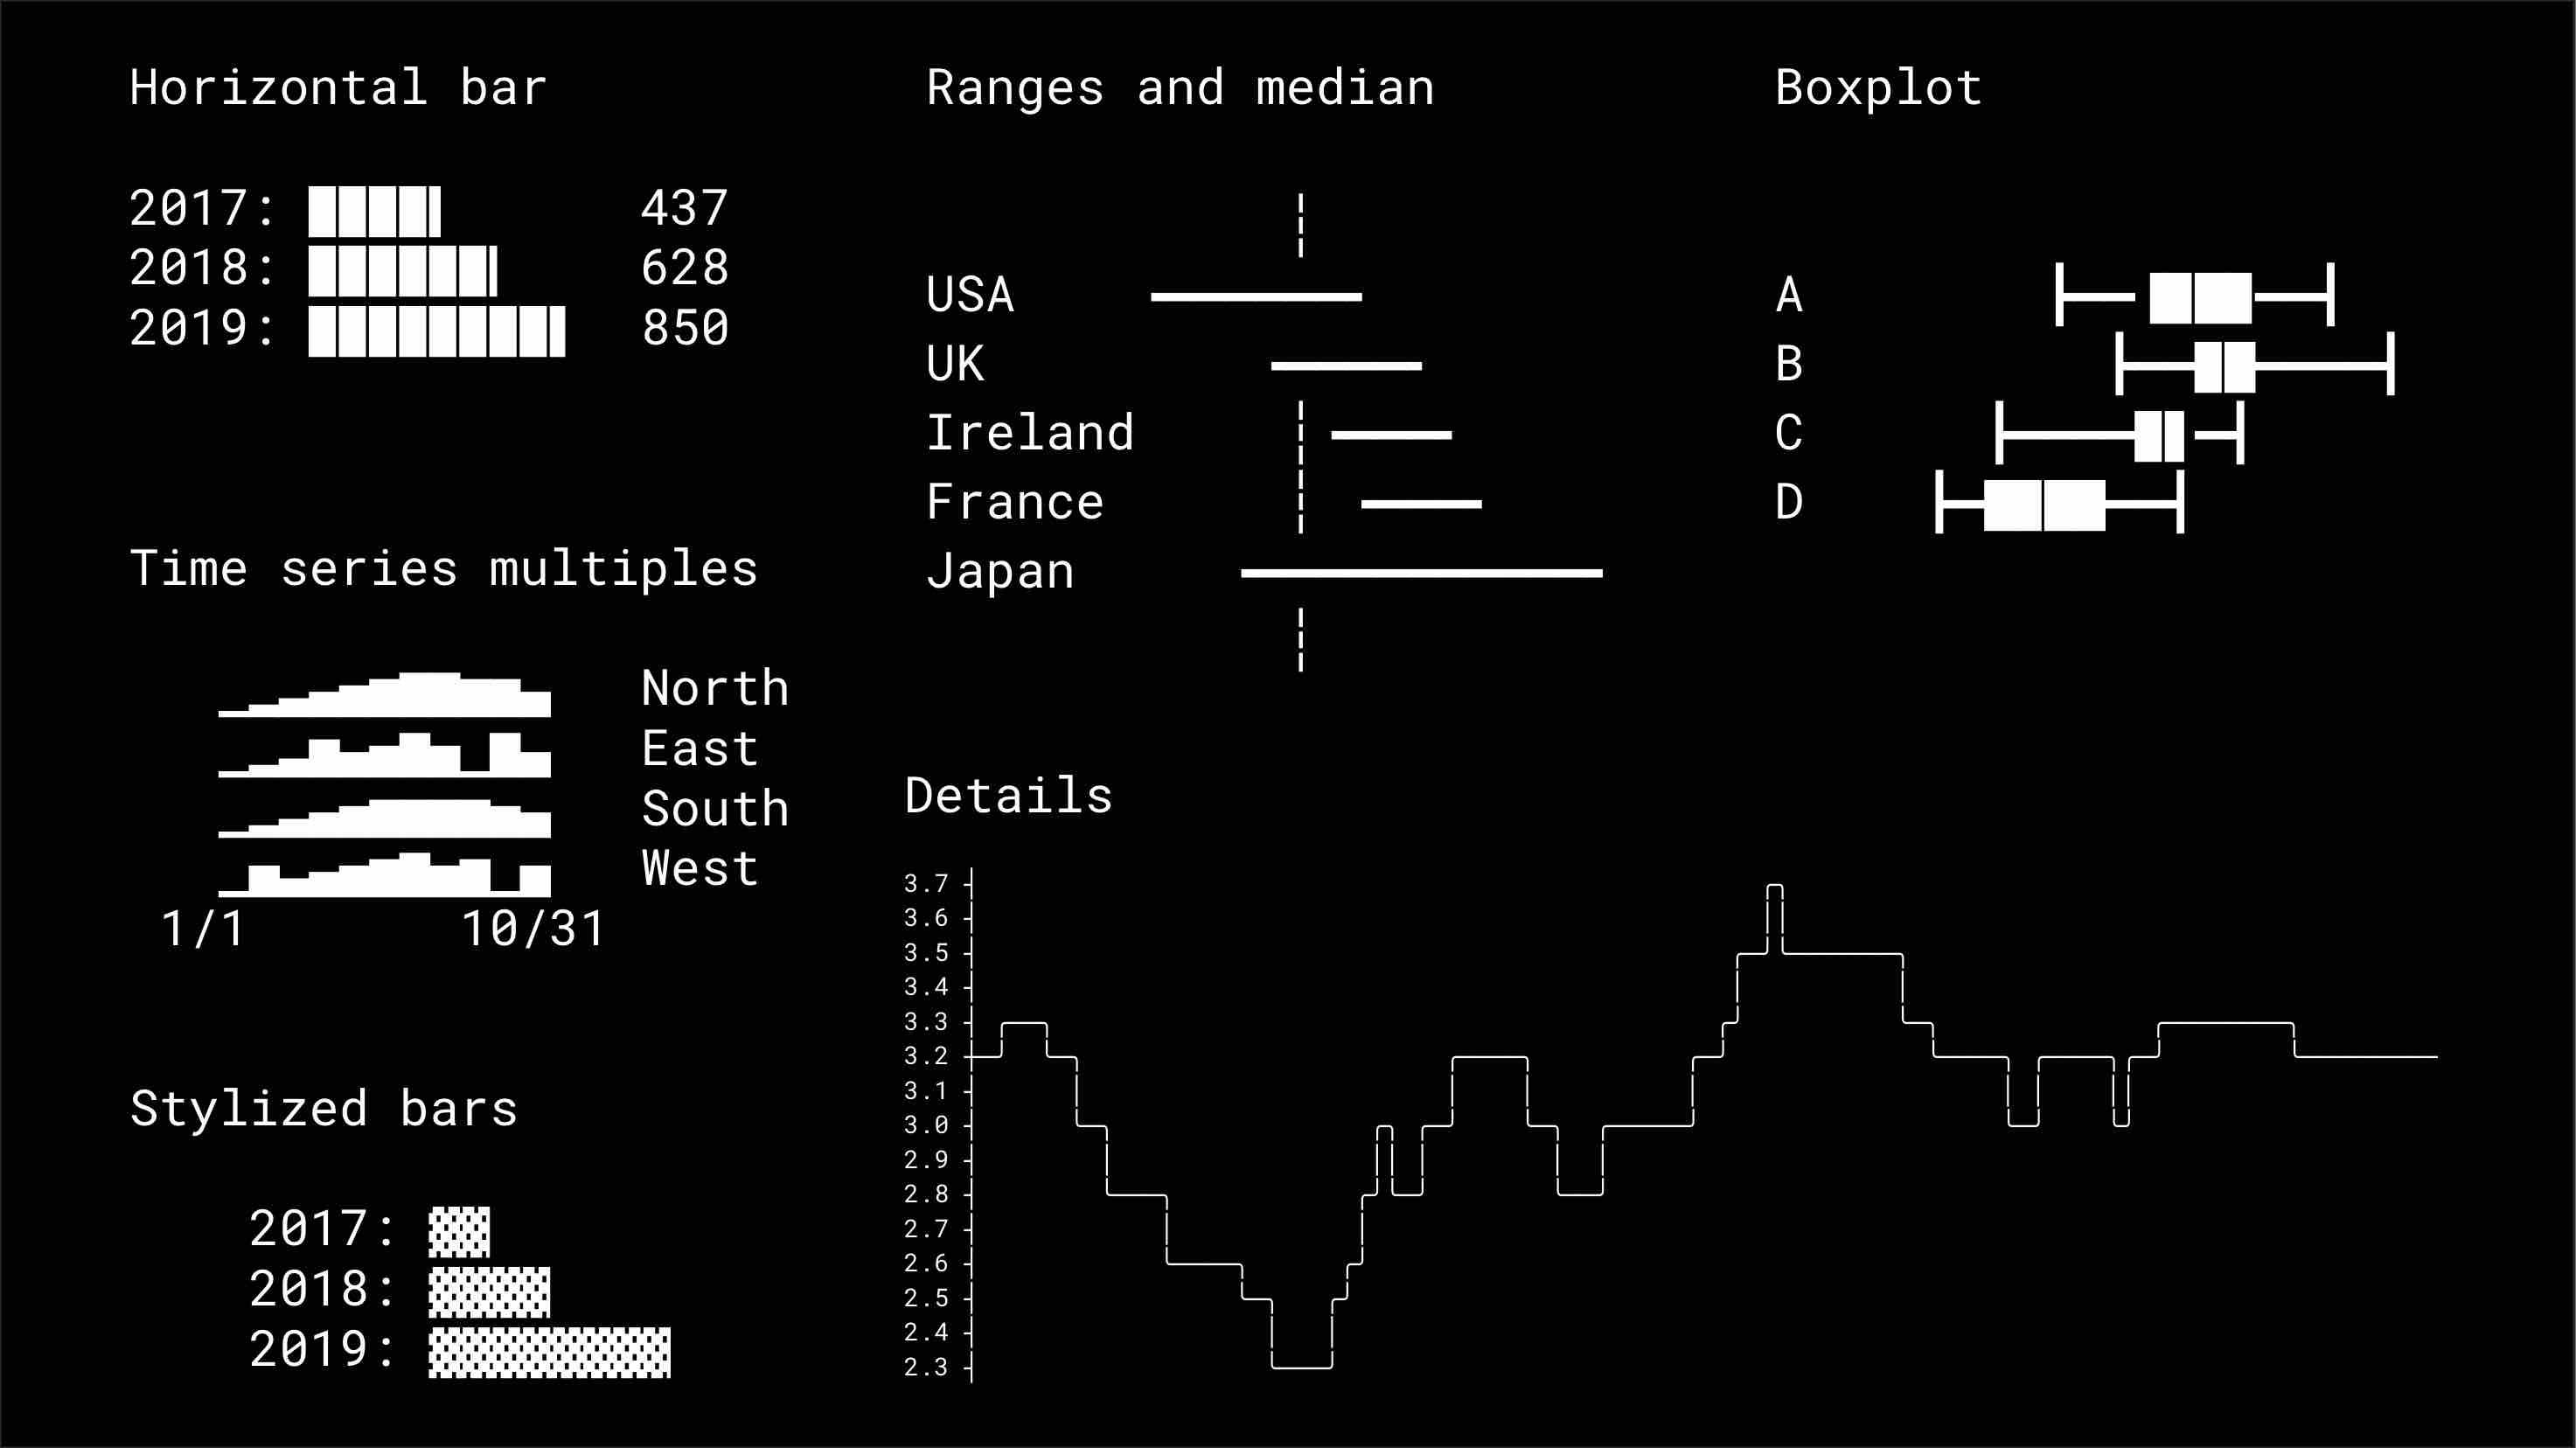
unicode character charts as slack bot query response
Plotly multi-edge sankey diagram and d3 + force node drag&drop
Plotly webgl point cloud with adaptive point size
js-free svg fantasy map in 860 bytes
js-free interactive charting: tooltip, highlight, other interactions
configuration of live chart with d3 and functional reactive programming
Plotly surface lighting iteration with webgl
Plotly infinity table with 1 million rows, drag&drop columns
higher than 32 bit precision webgl floats (to be added)
reactive visualizations with d3
explorer charts for behavioral finance
animated webgl vehicle layer synced with google maps pan/zoom (to be added)
brownian motion with d3 force
d3 verlet force animal
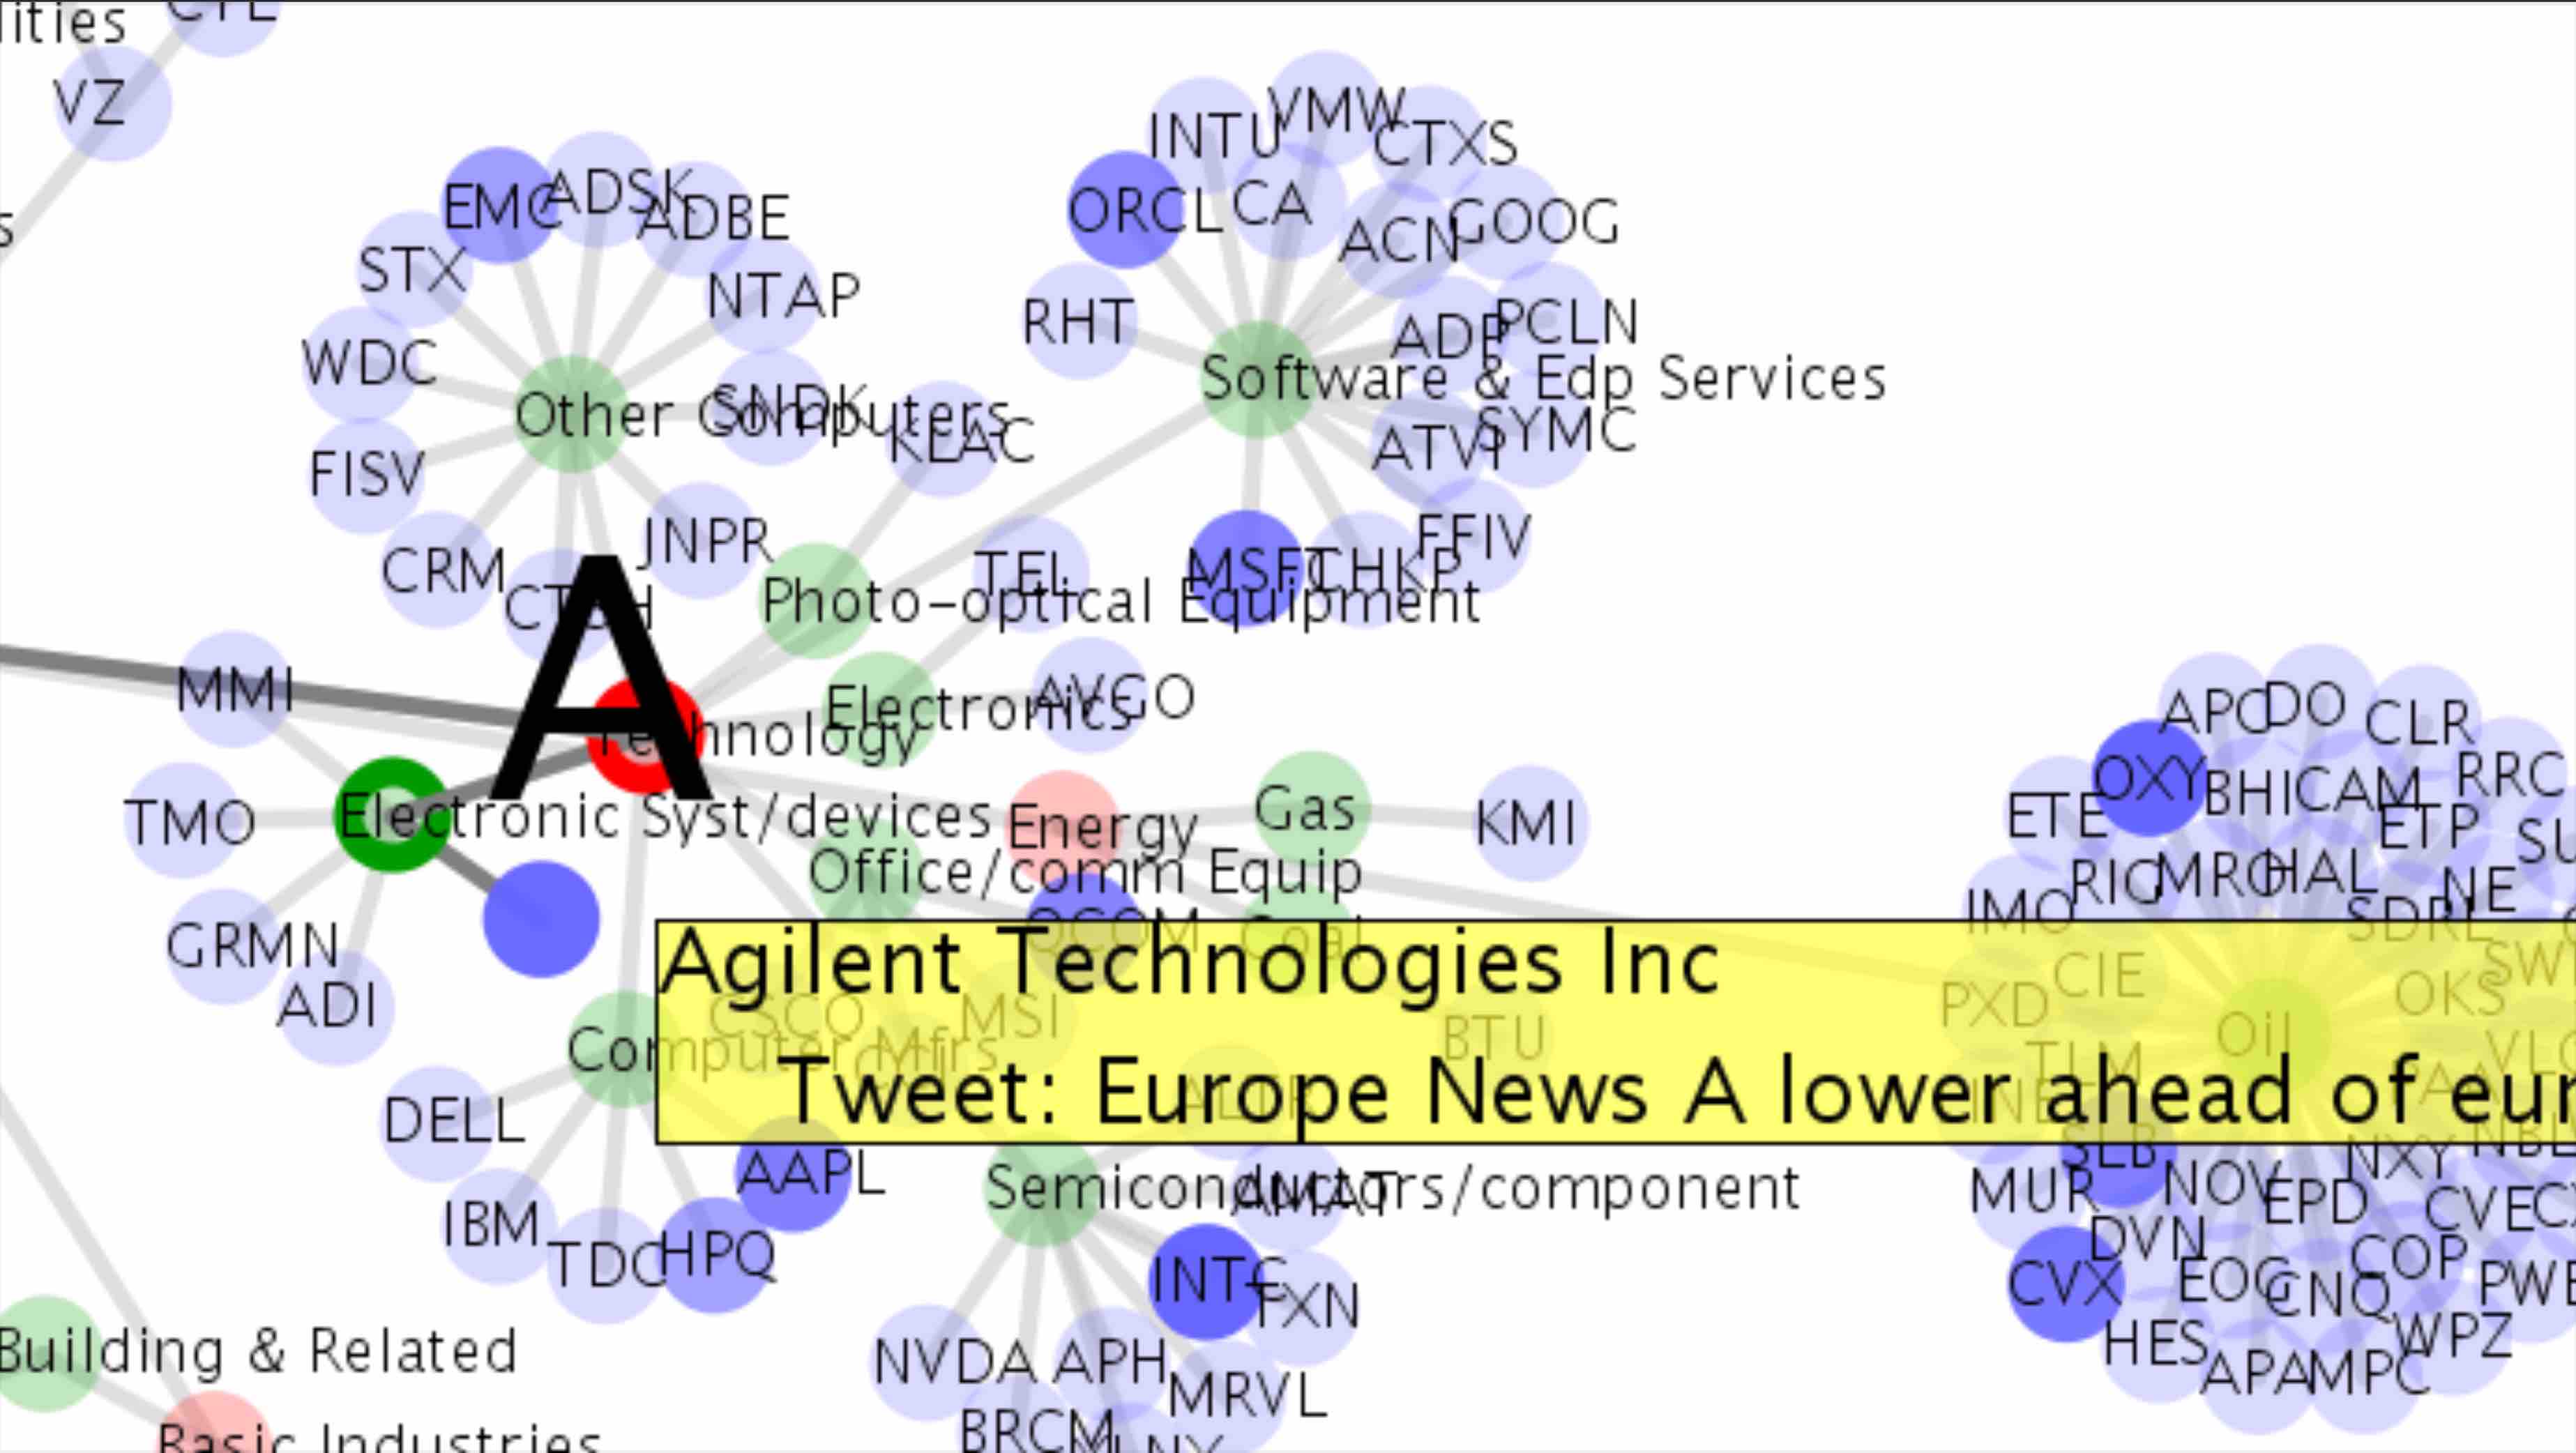
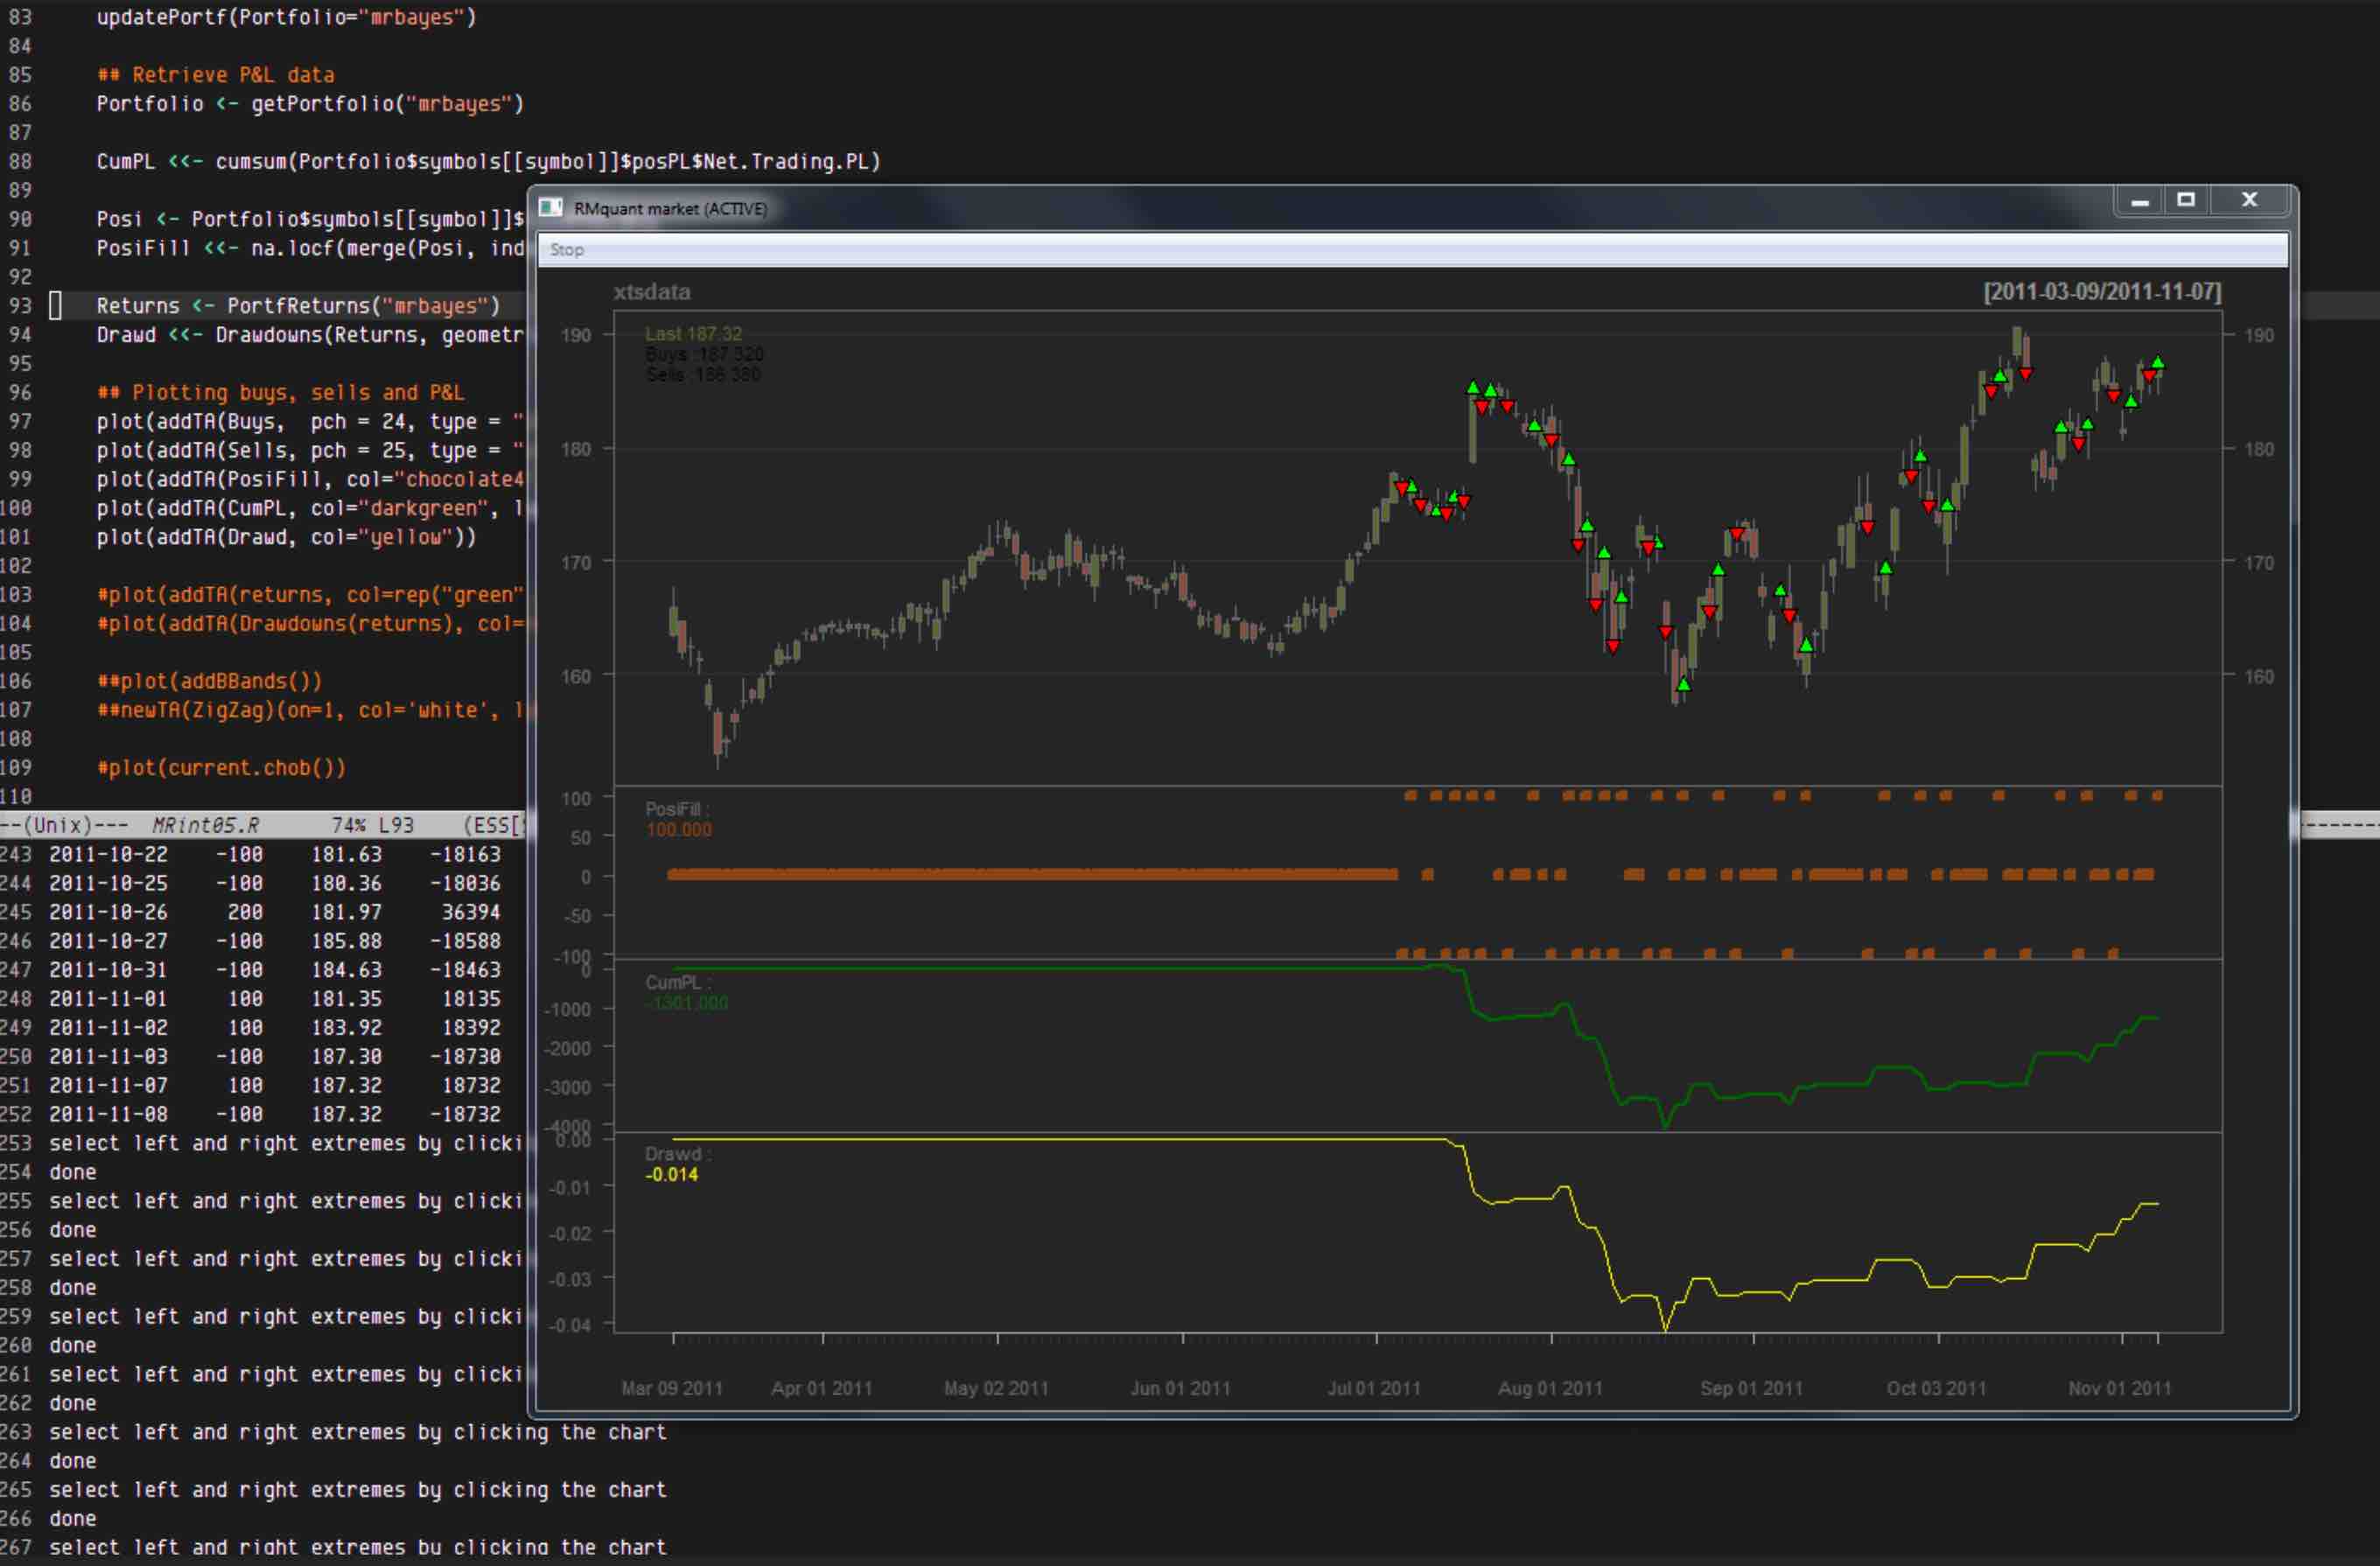
financial markets navigator
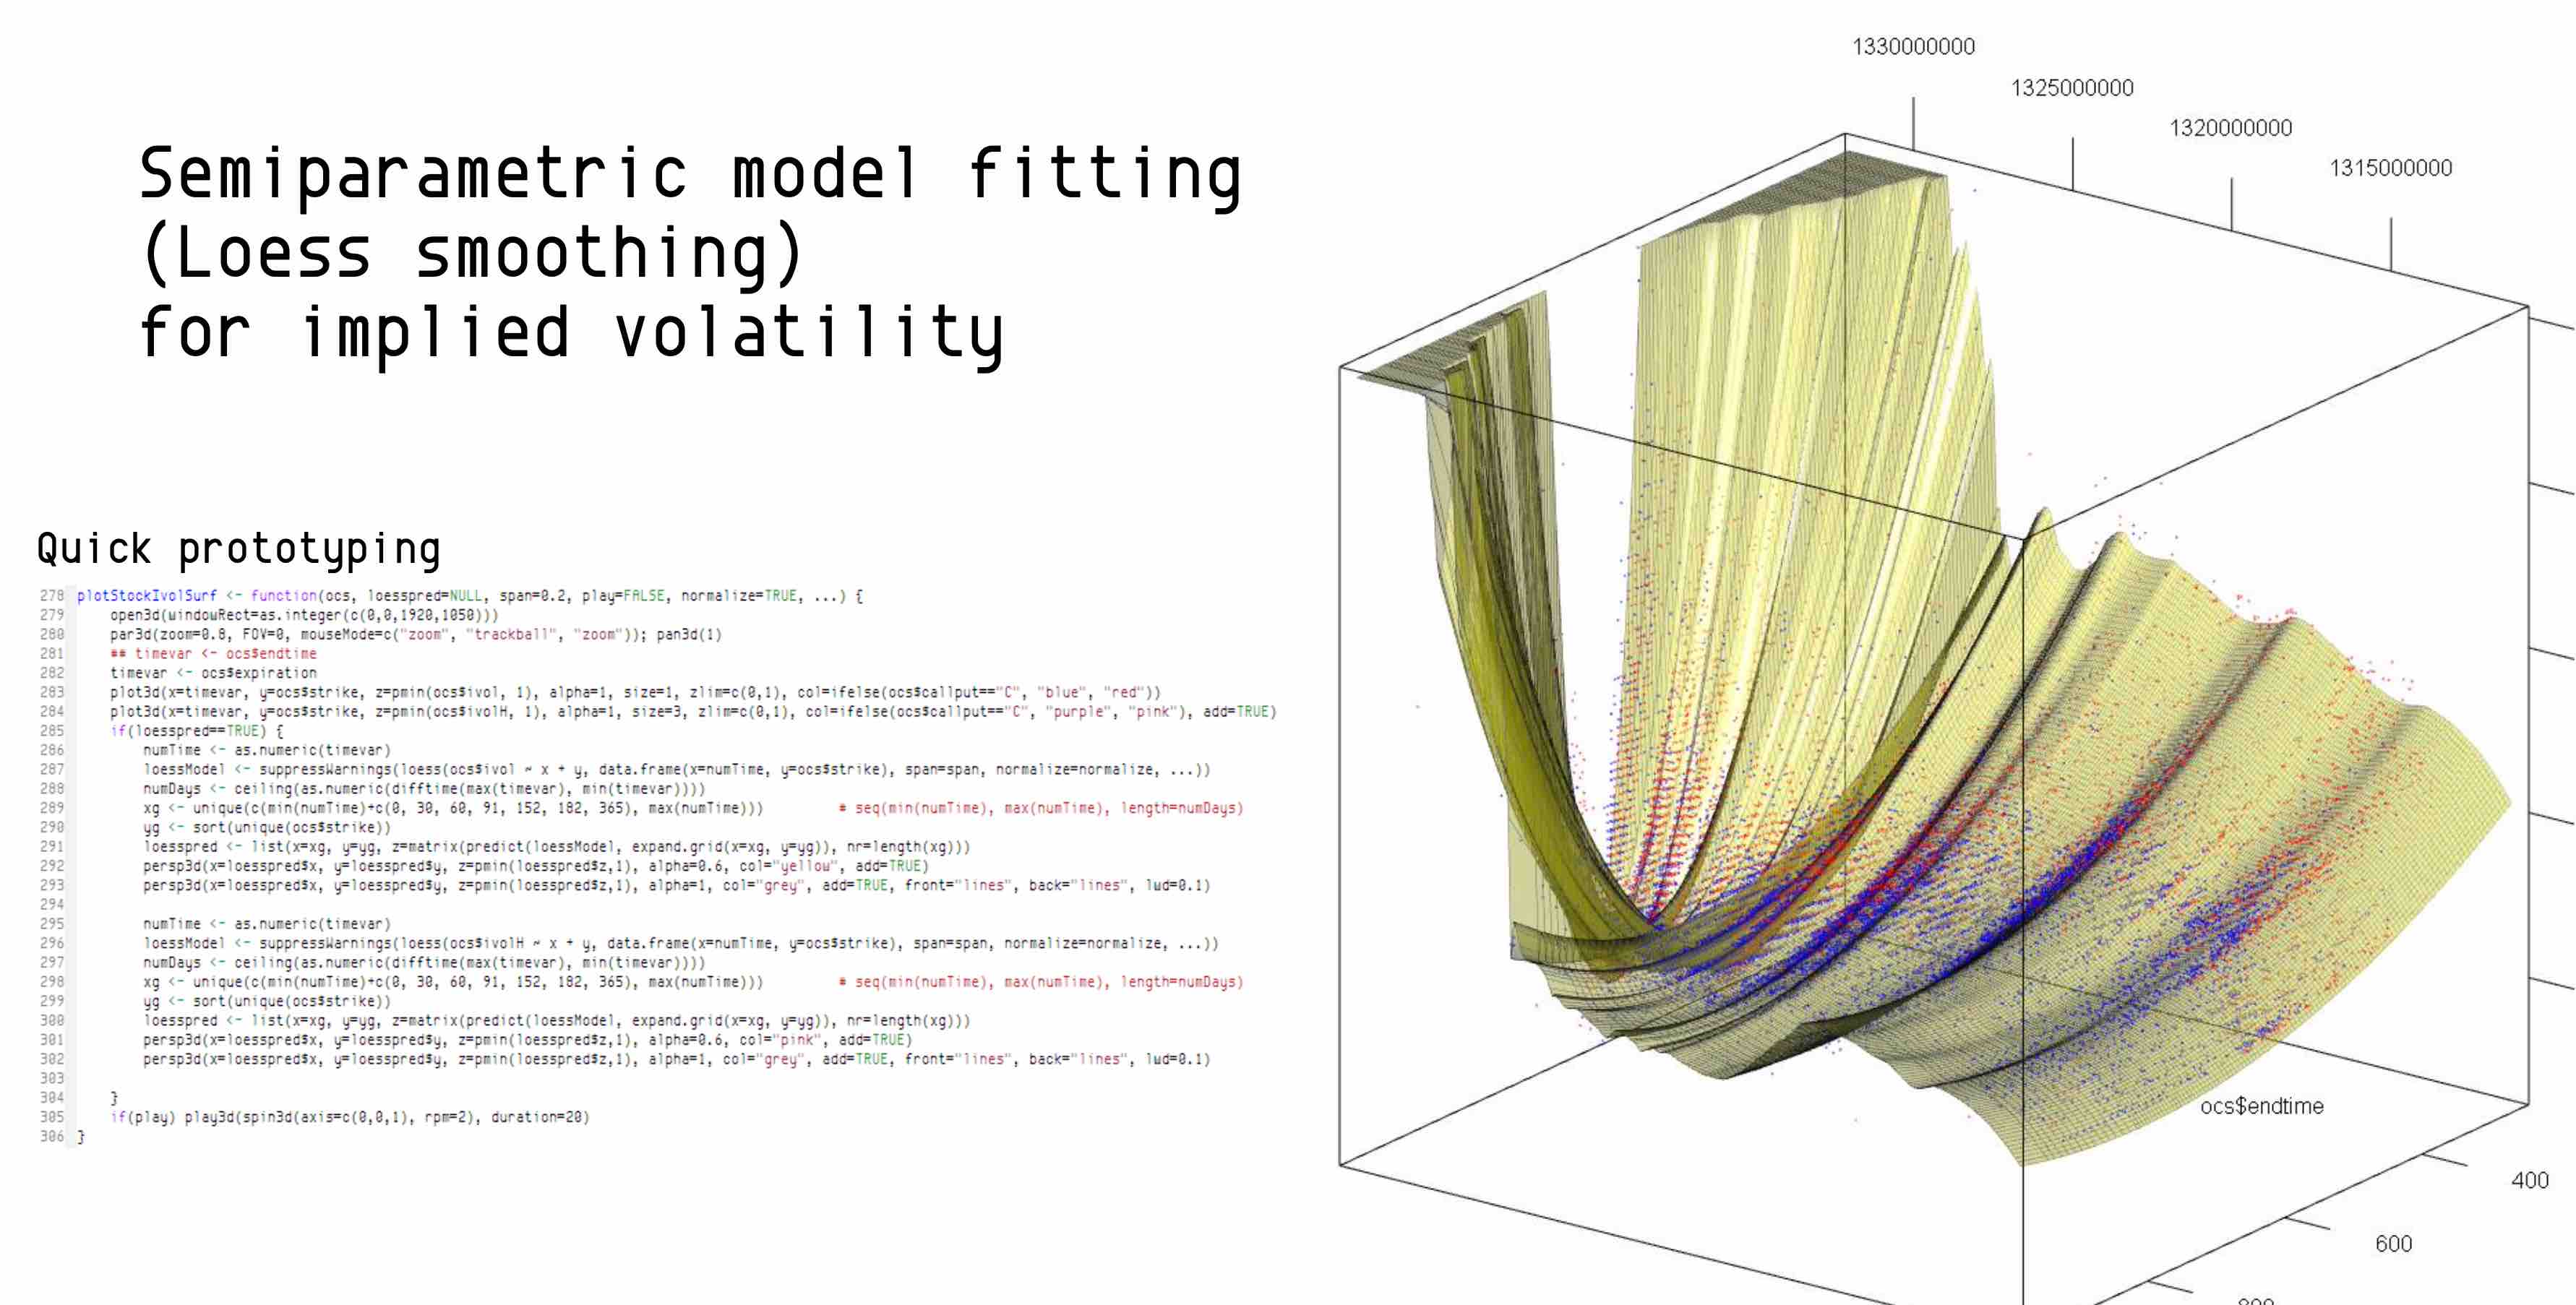
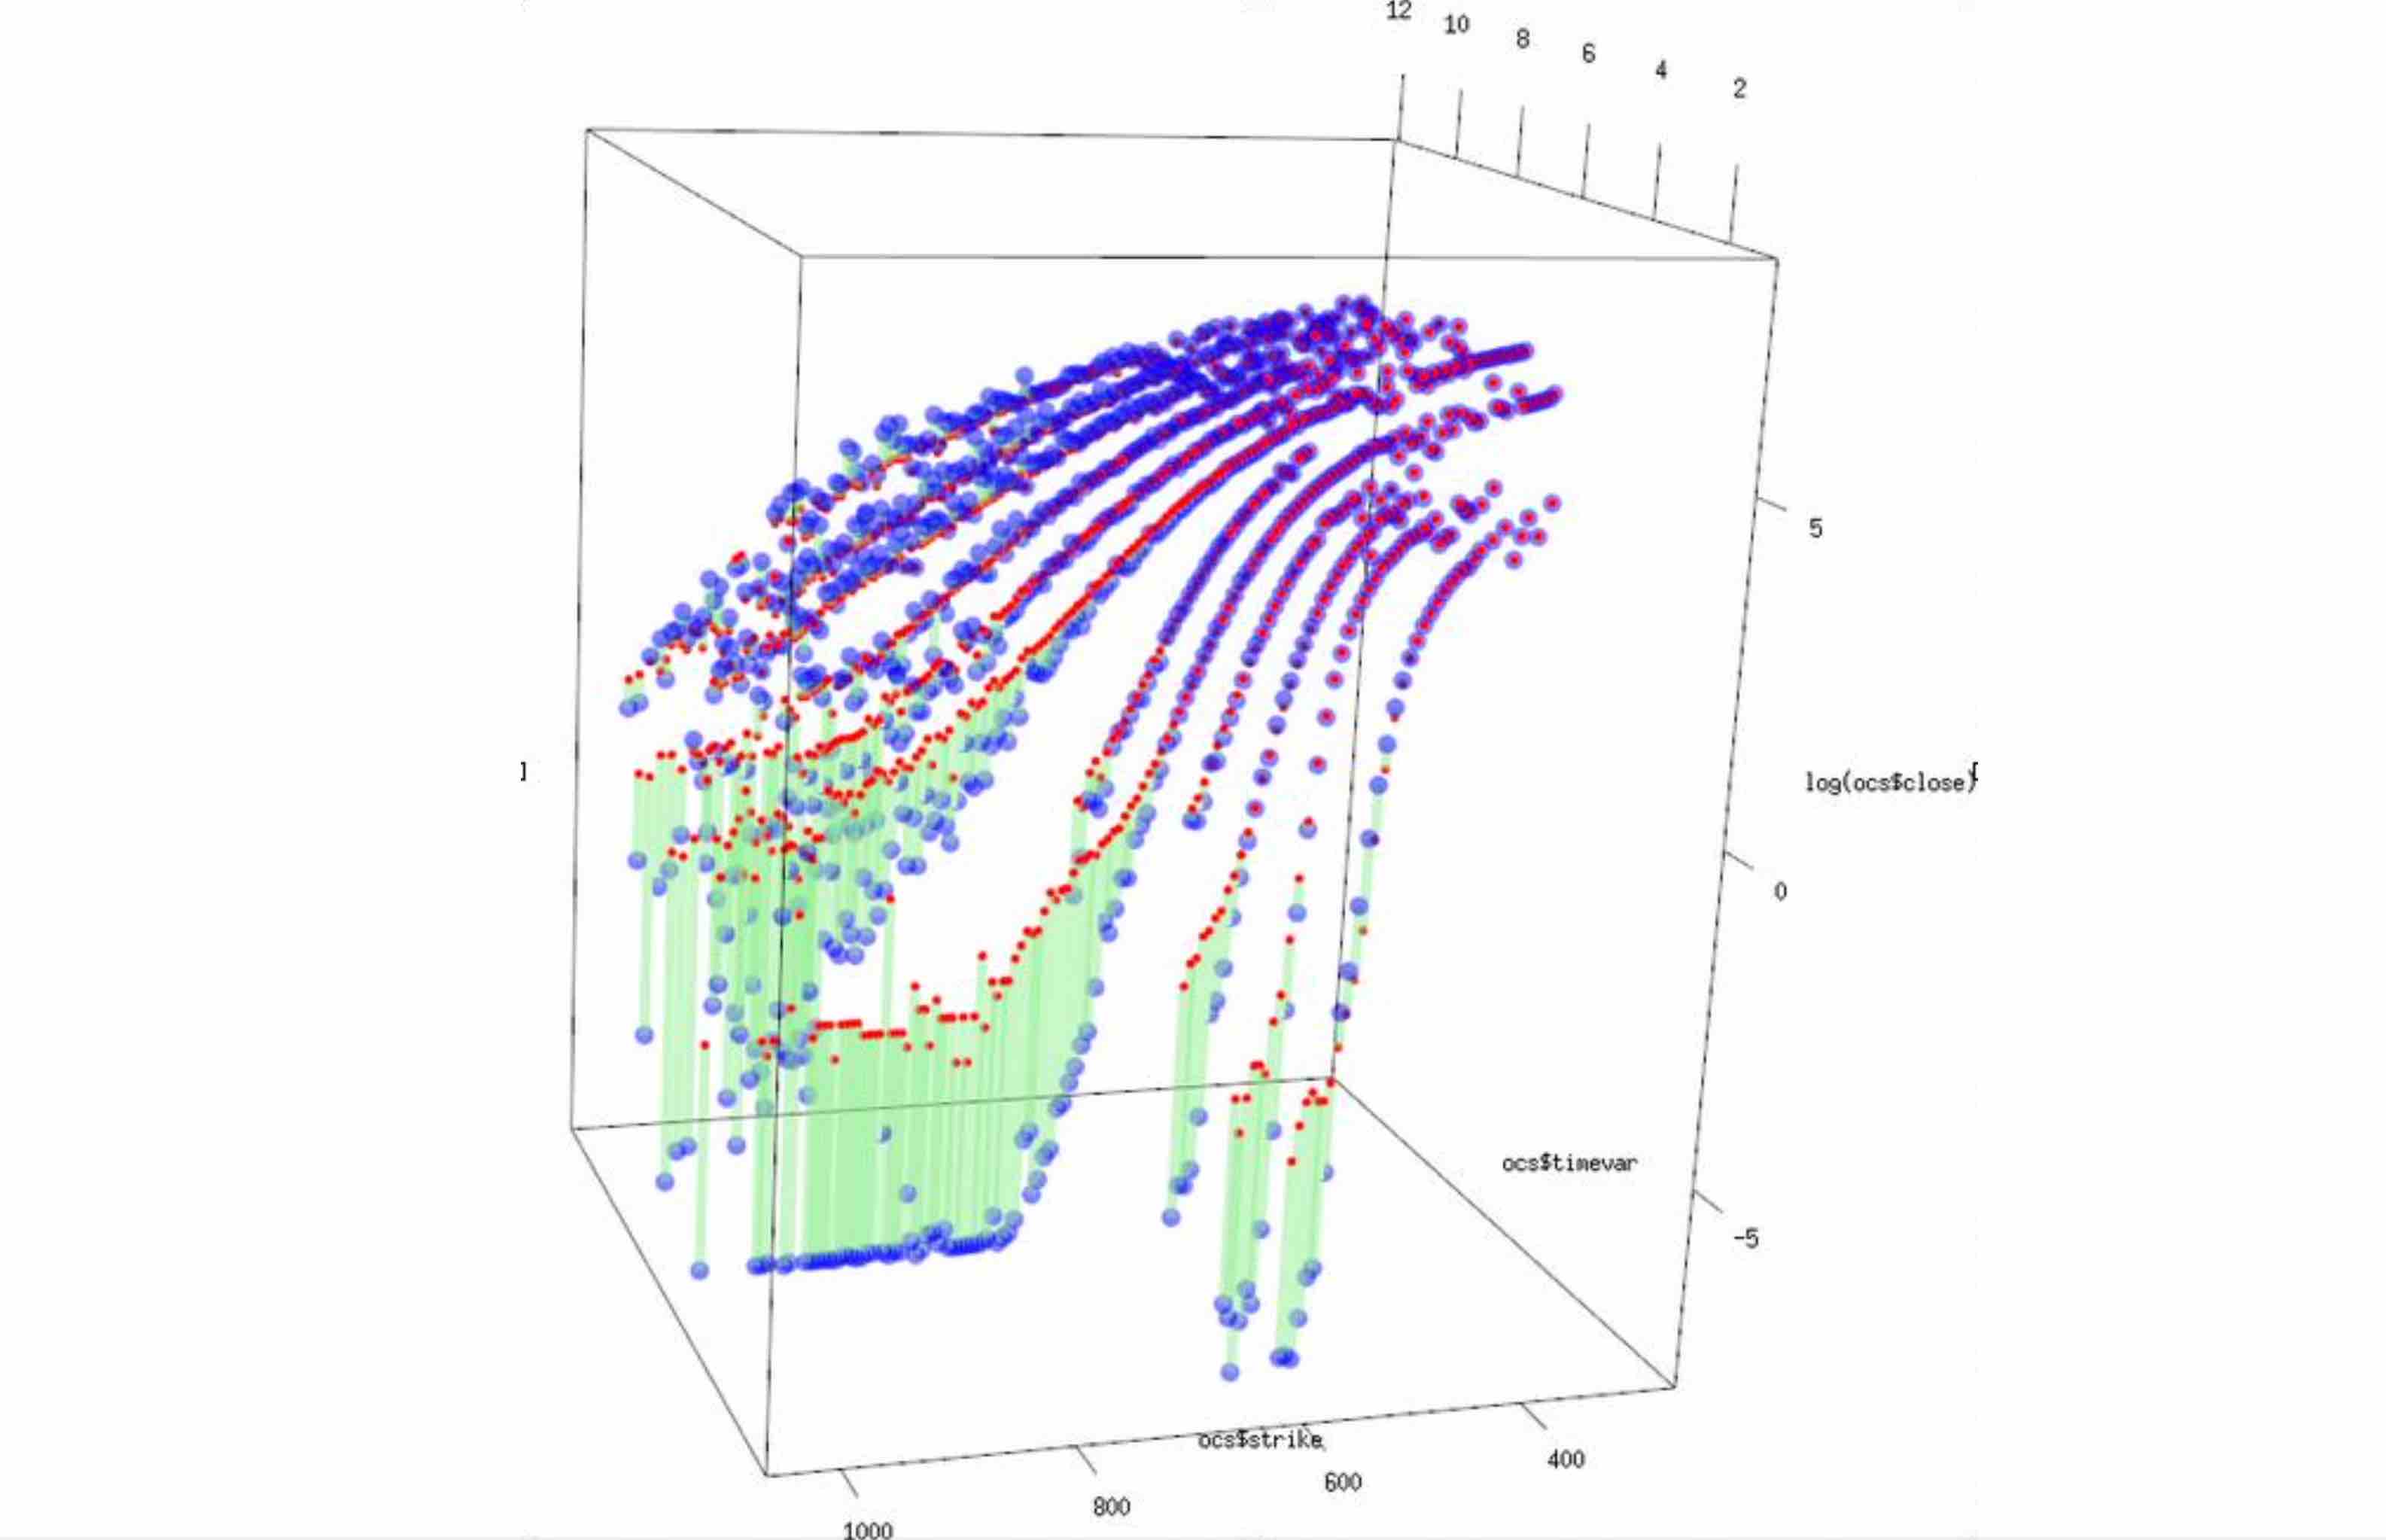
Loess semiparametric model fitting
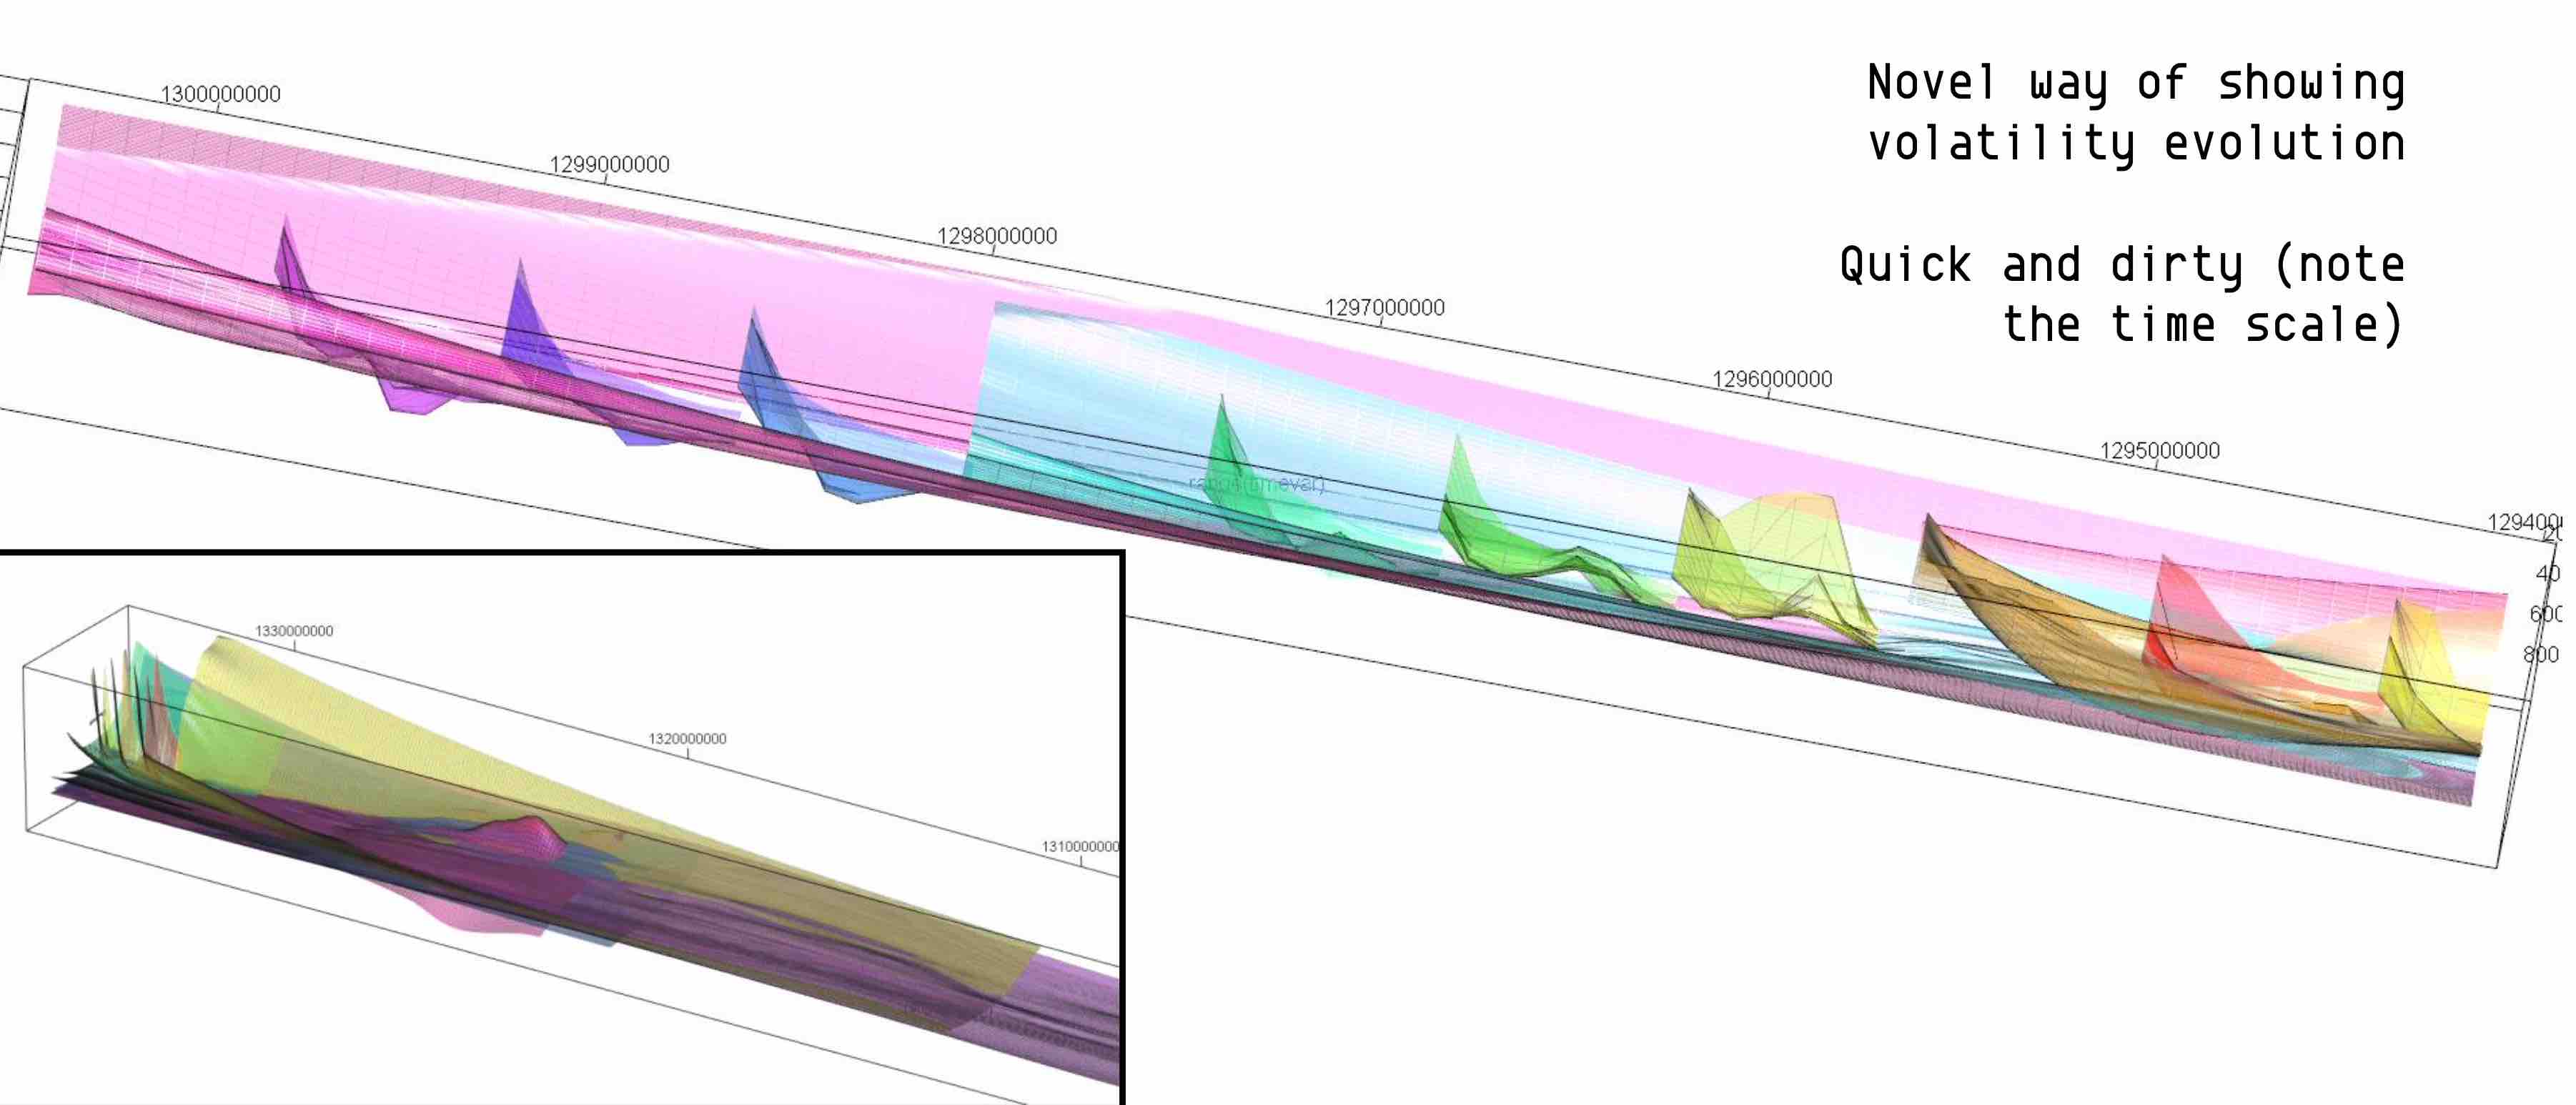
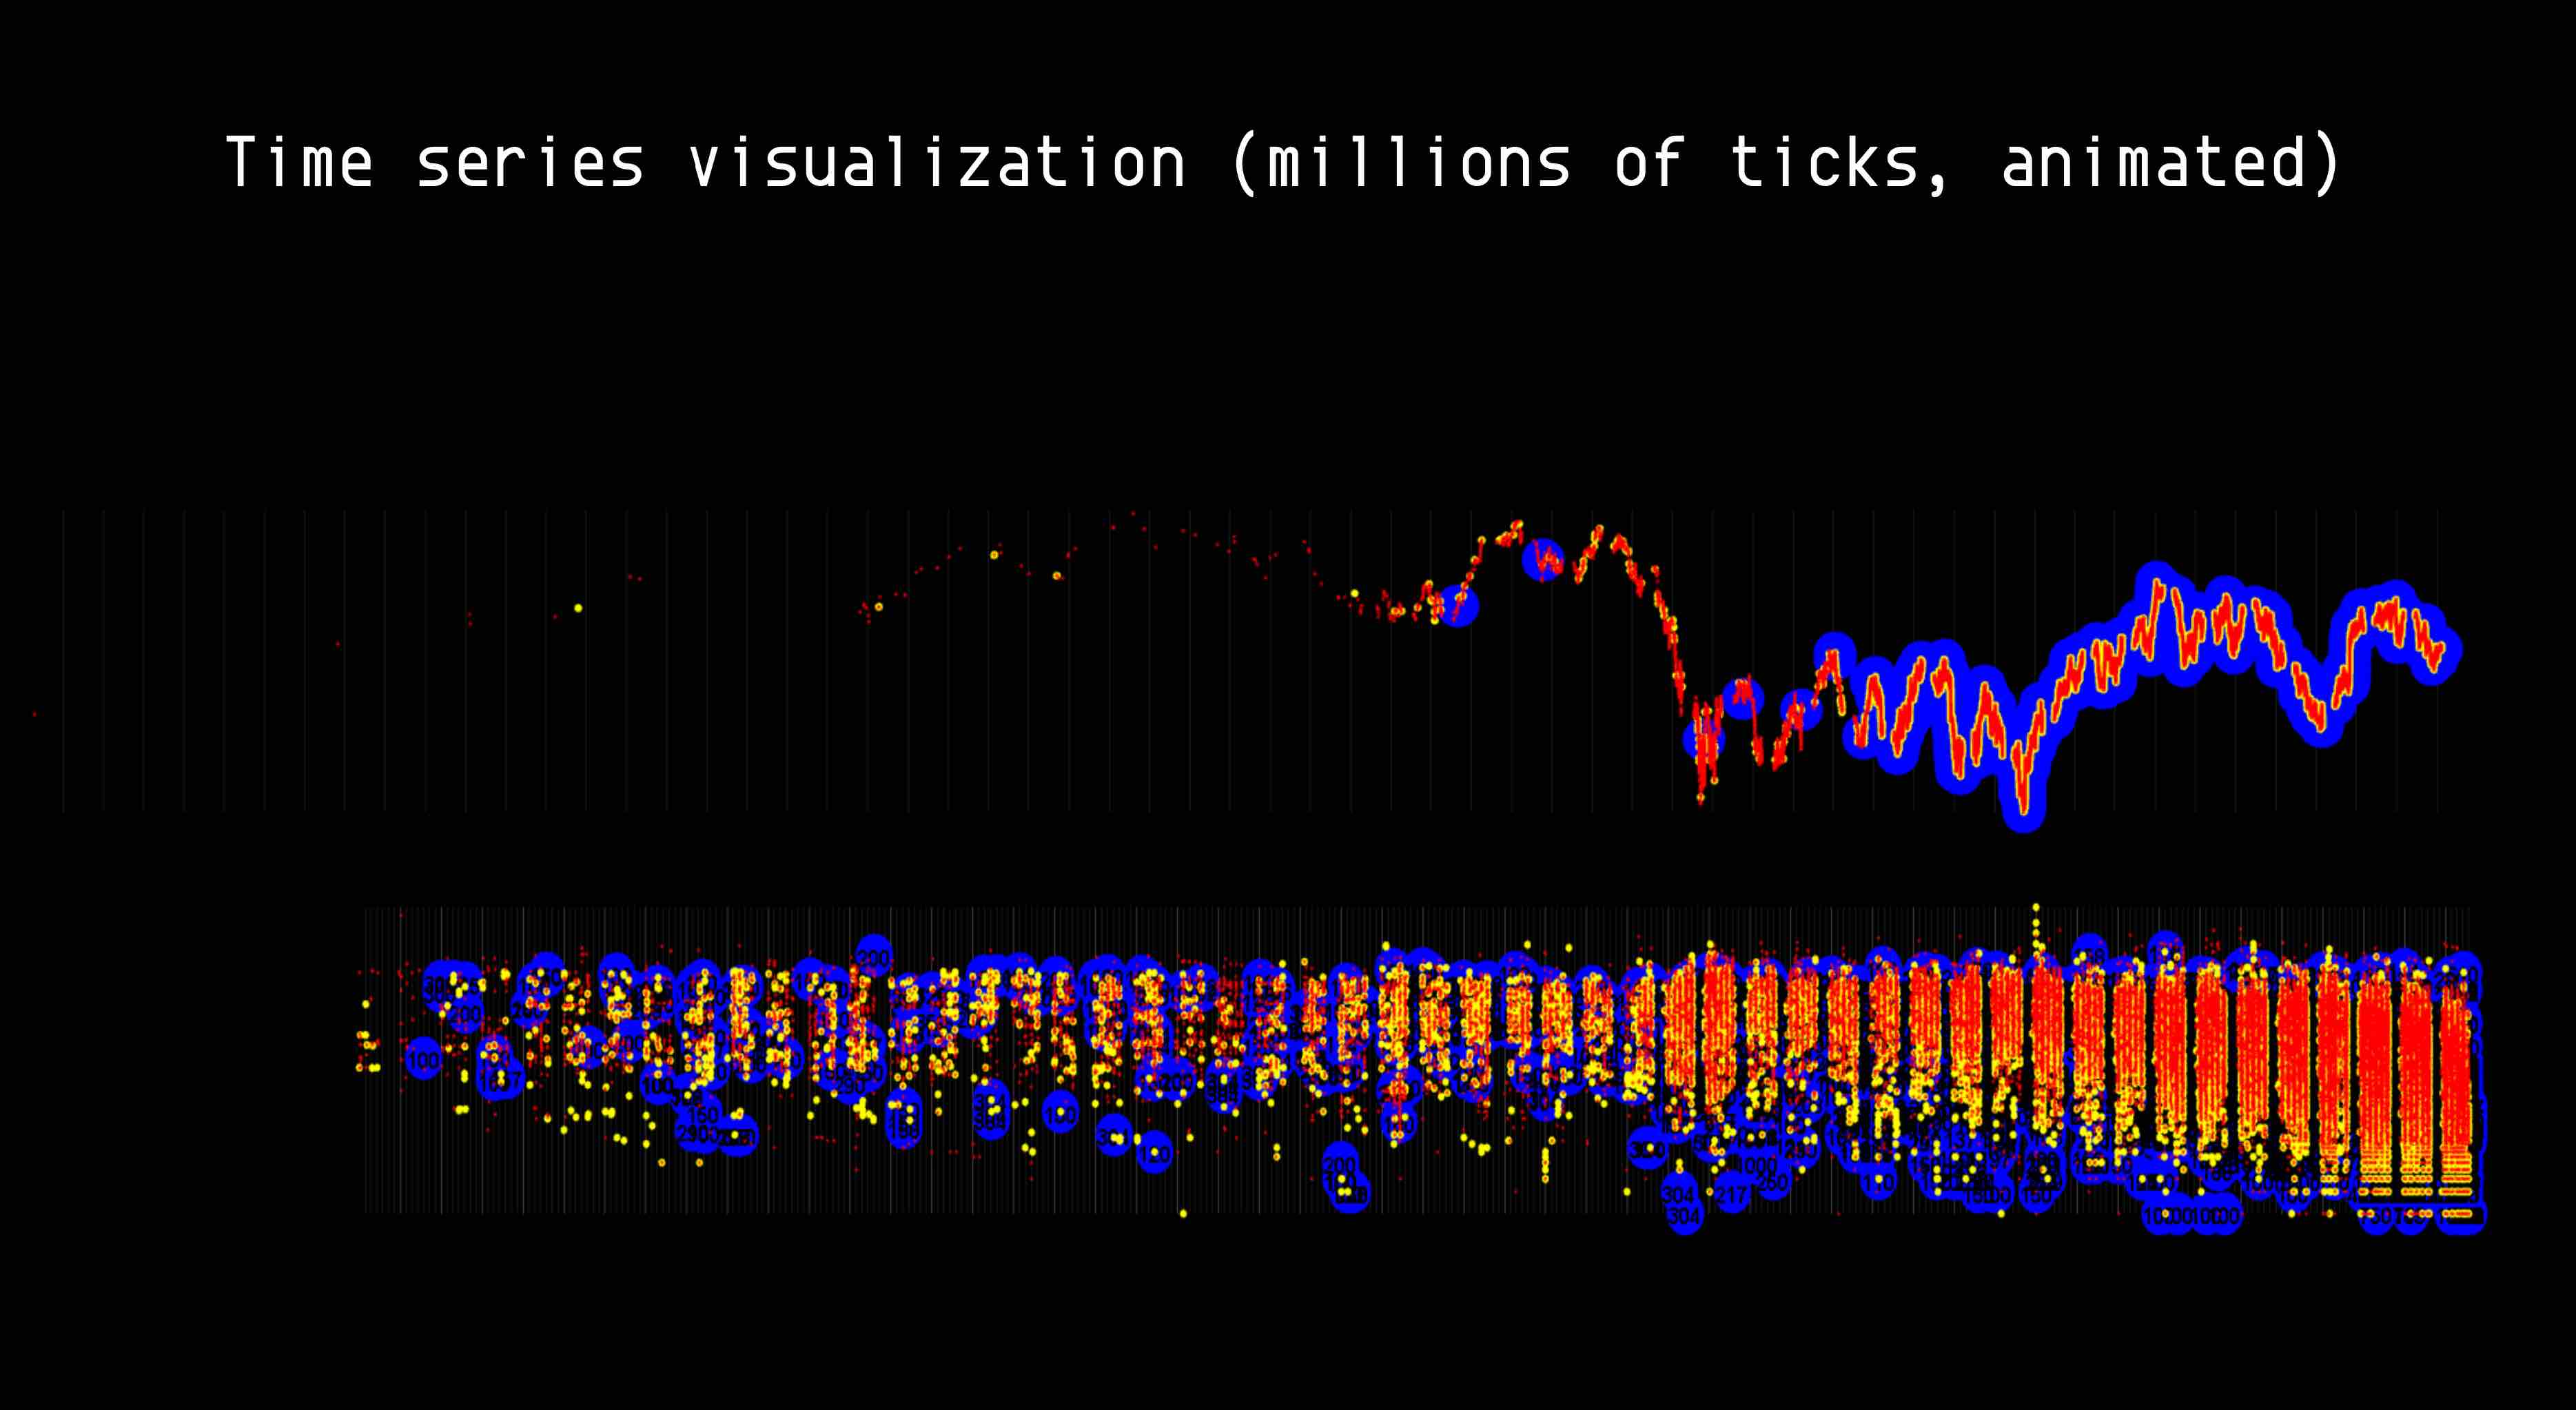
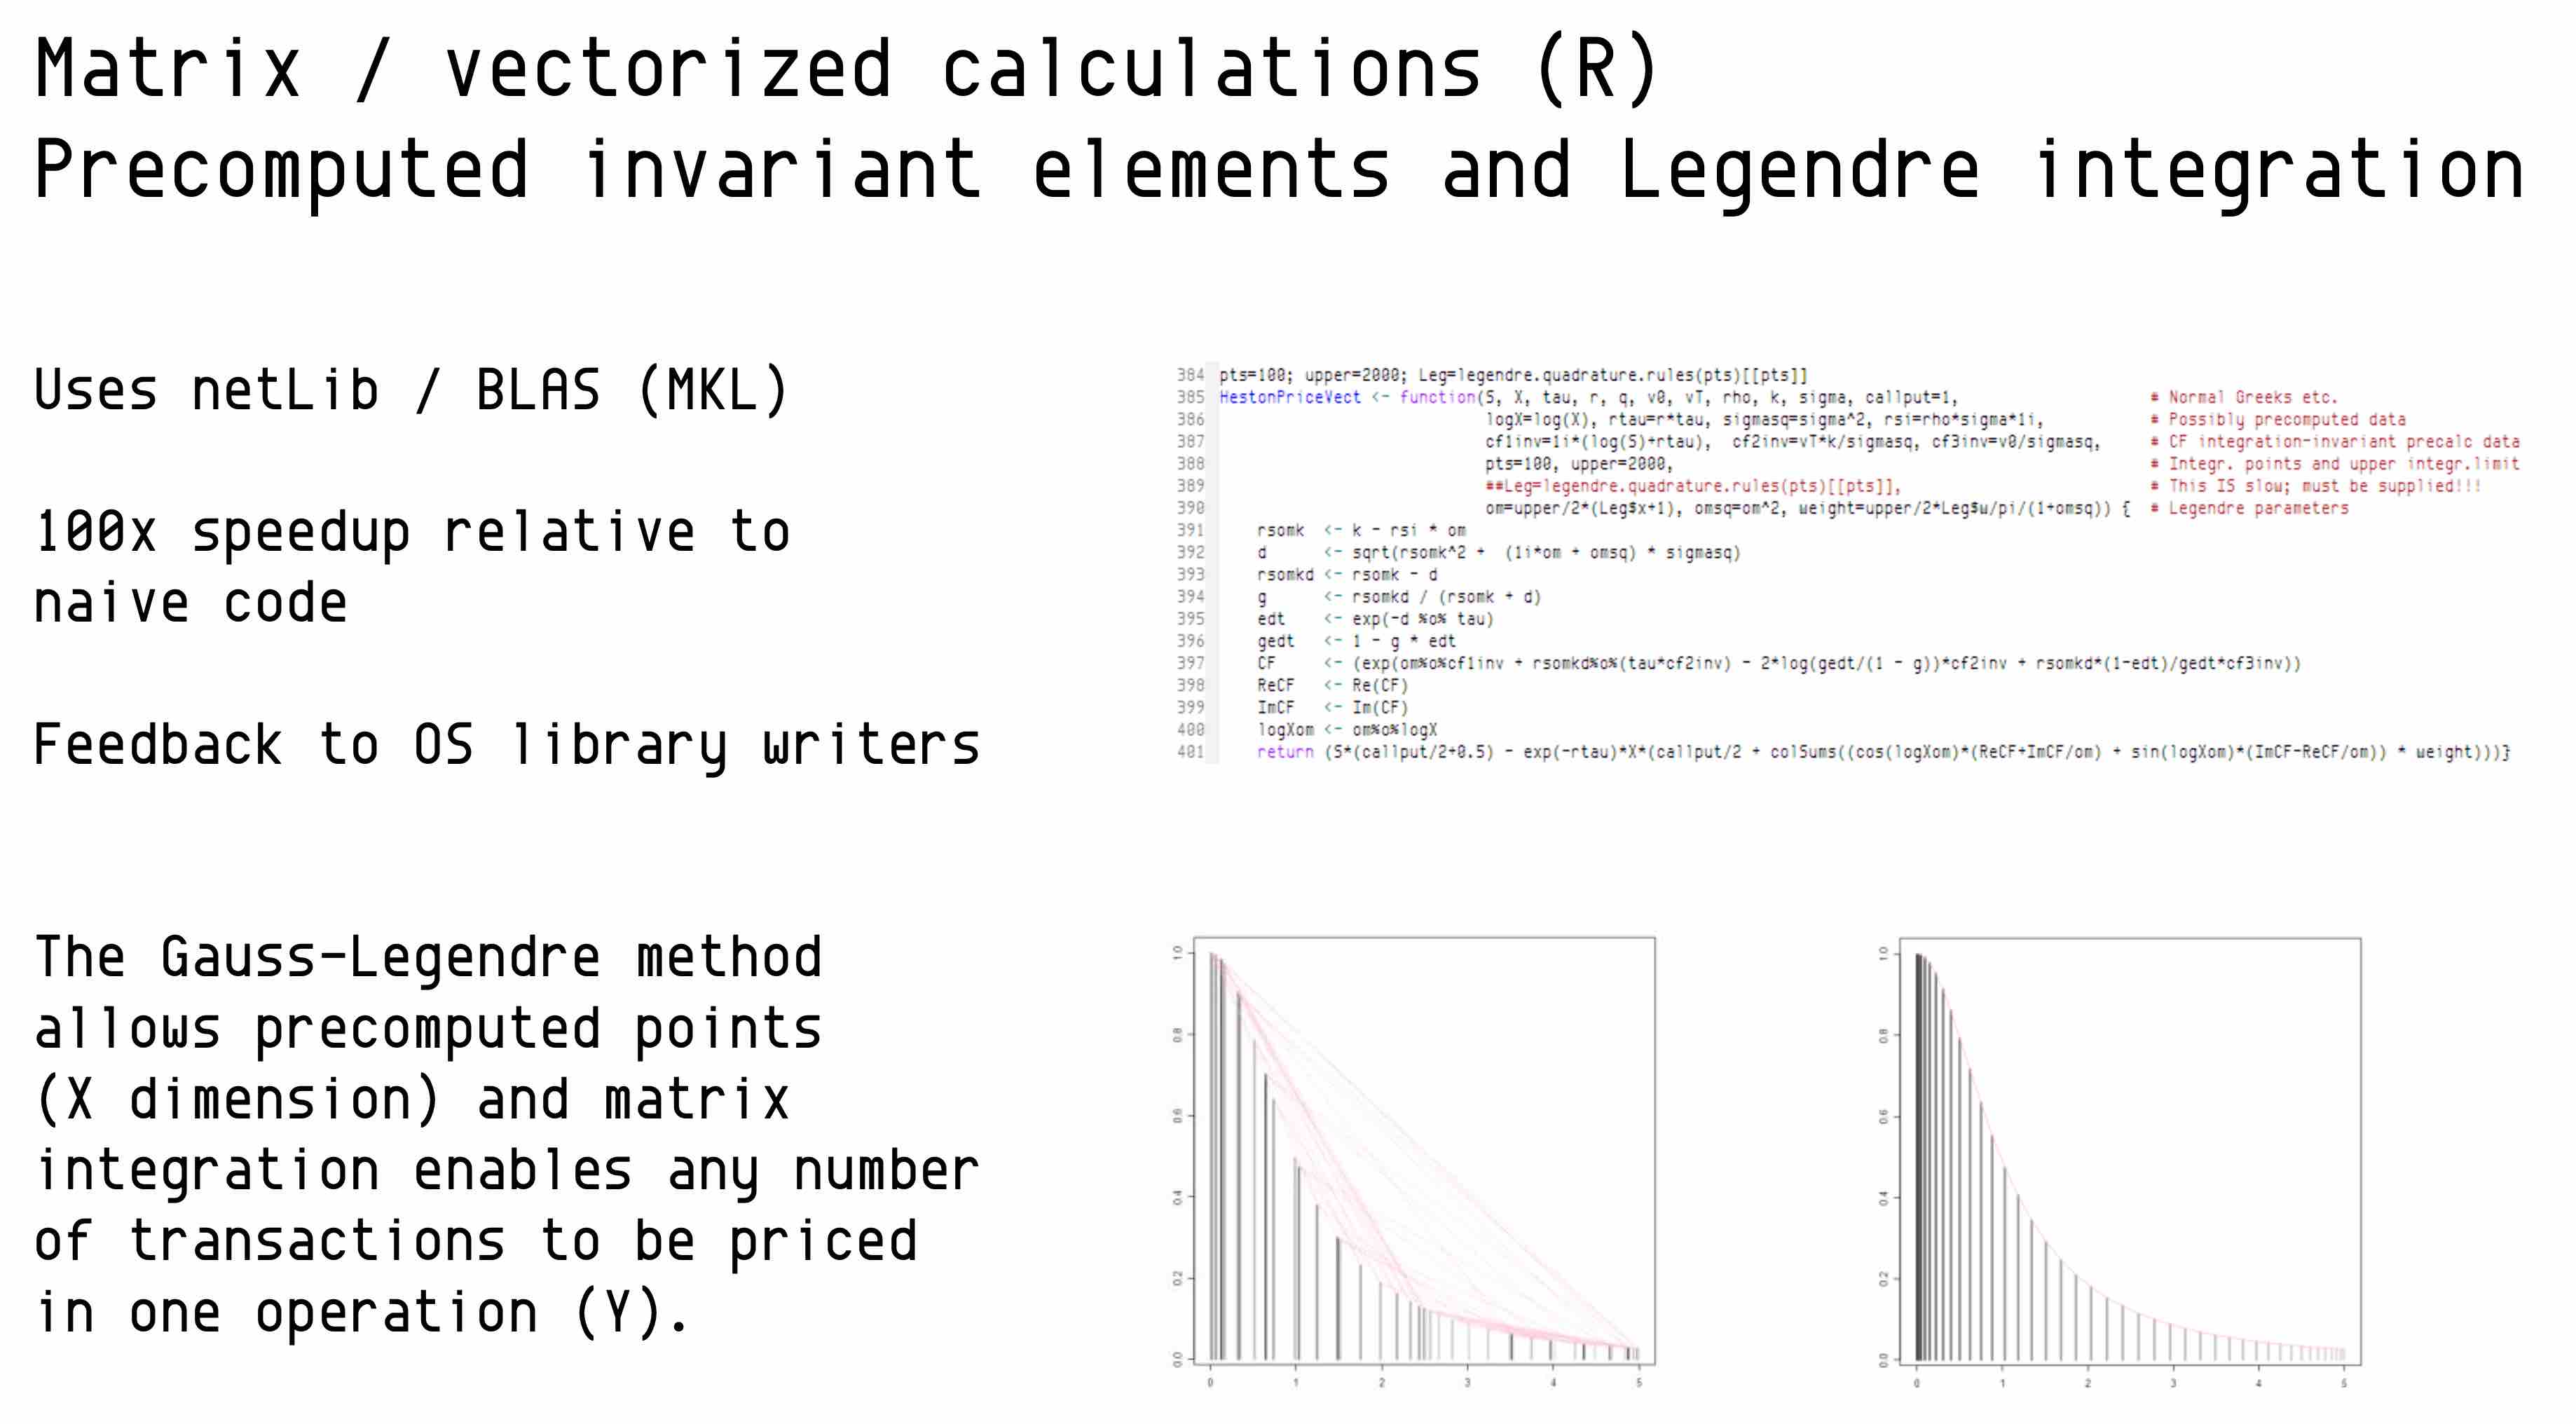
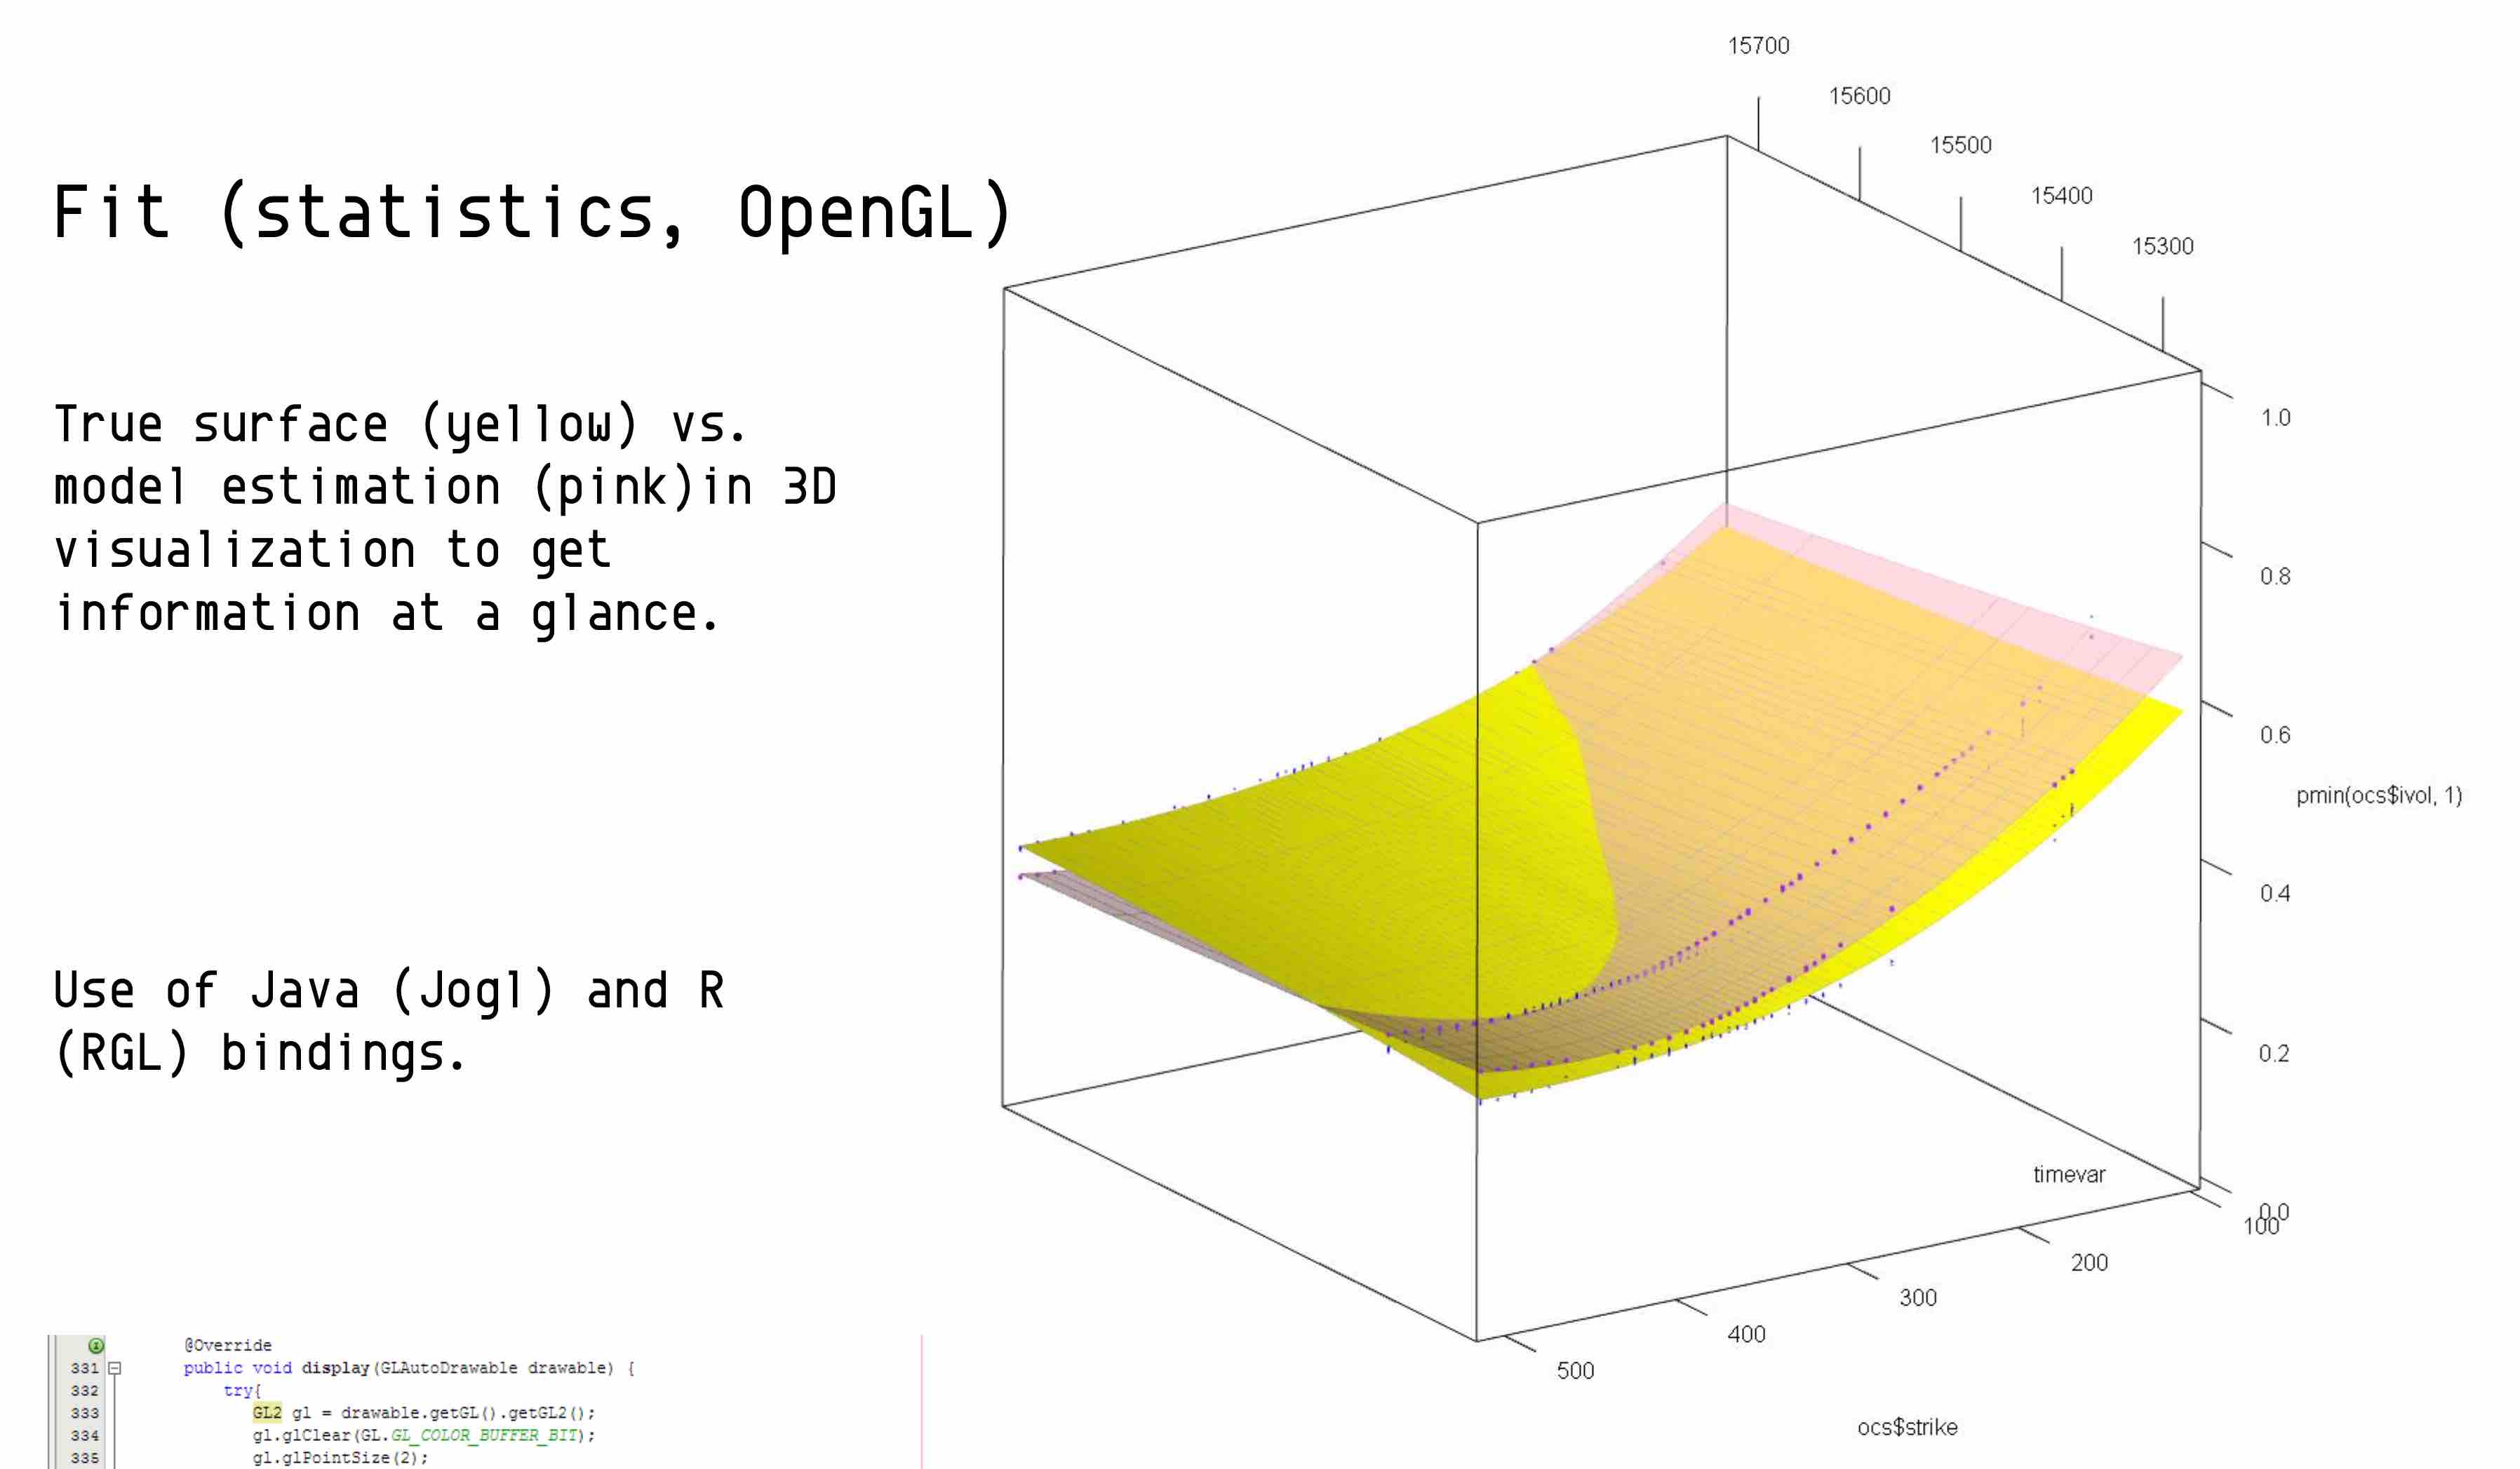
financial visualization in R
Heston-Bates model calibration to detect suspicious financial activity
volatility surface layers
heatmap-like time series
gauss-legendre method
fit and visualize in the same gpu memory
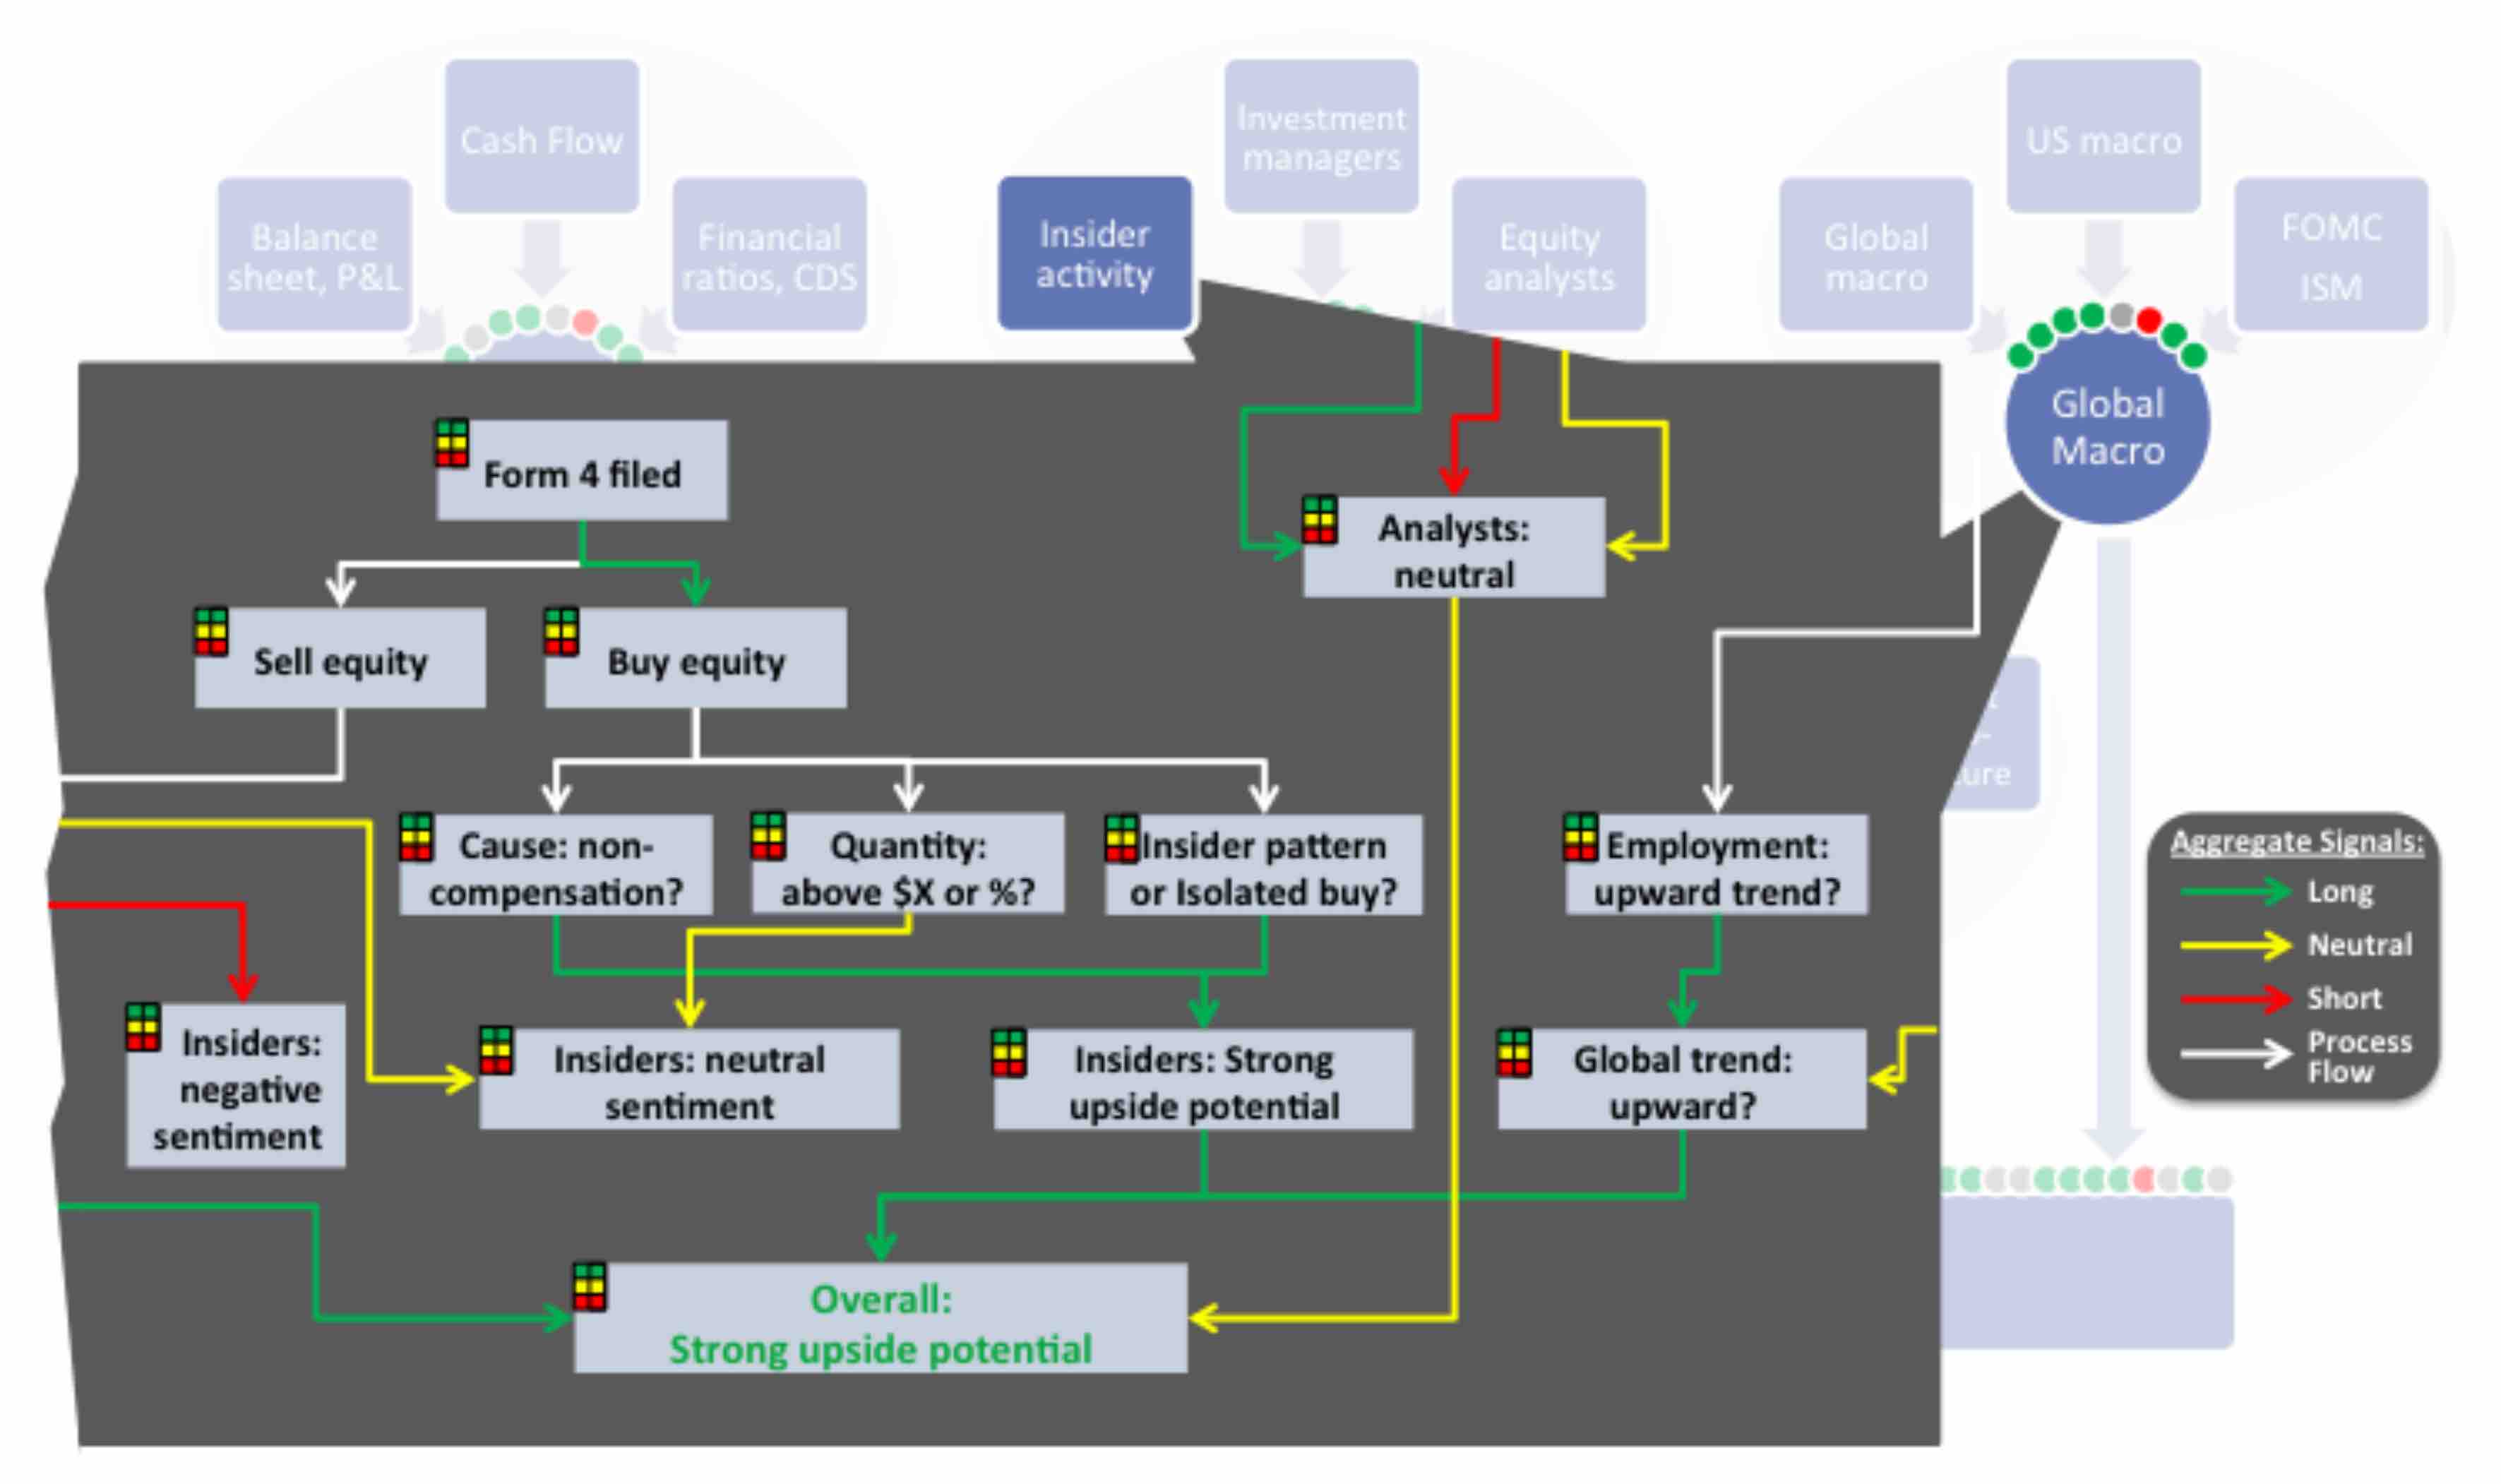
bayesian network illustration
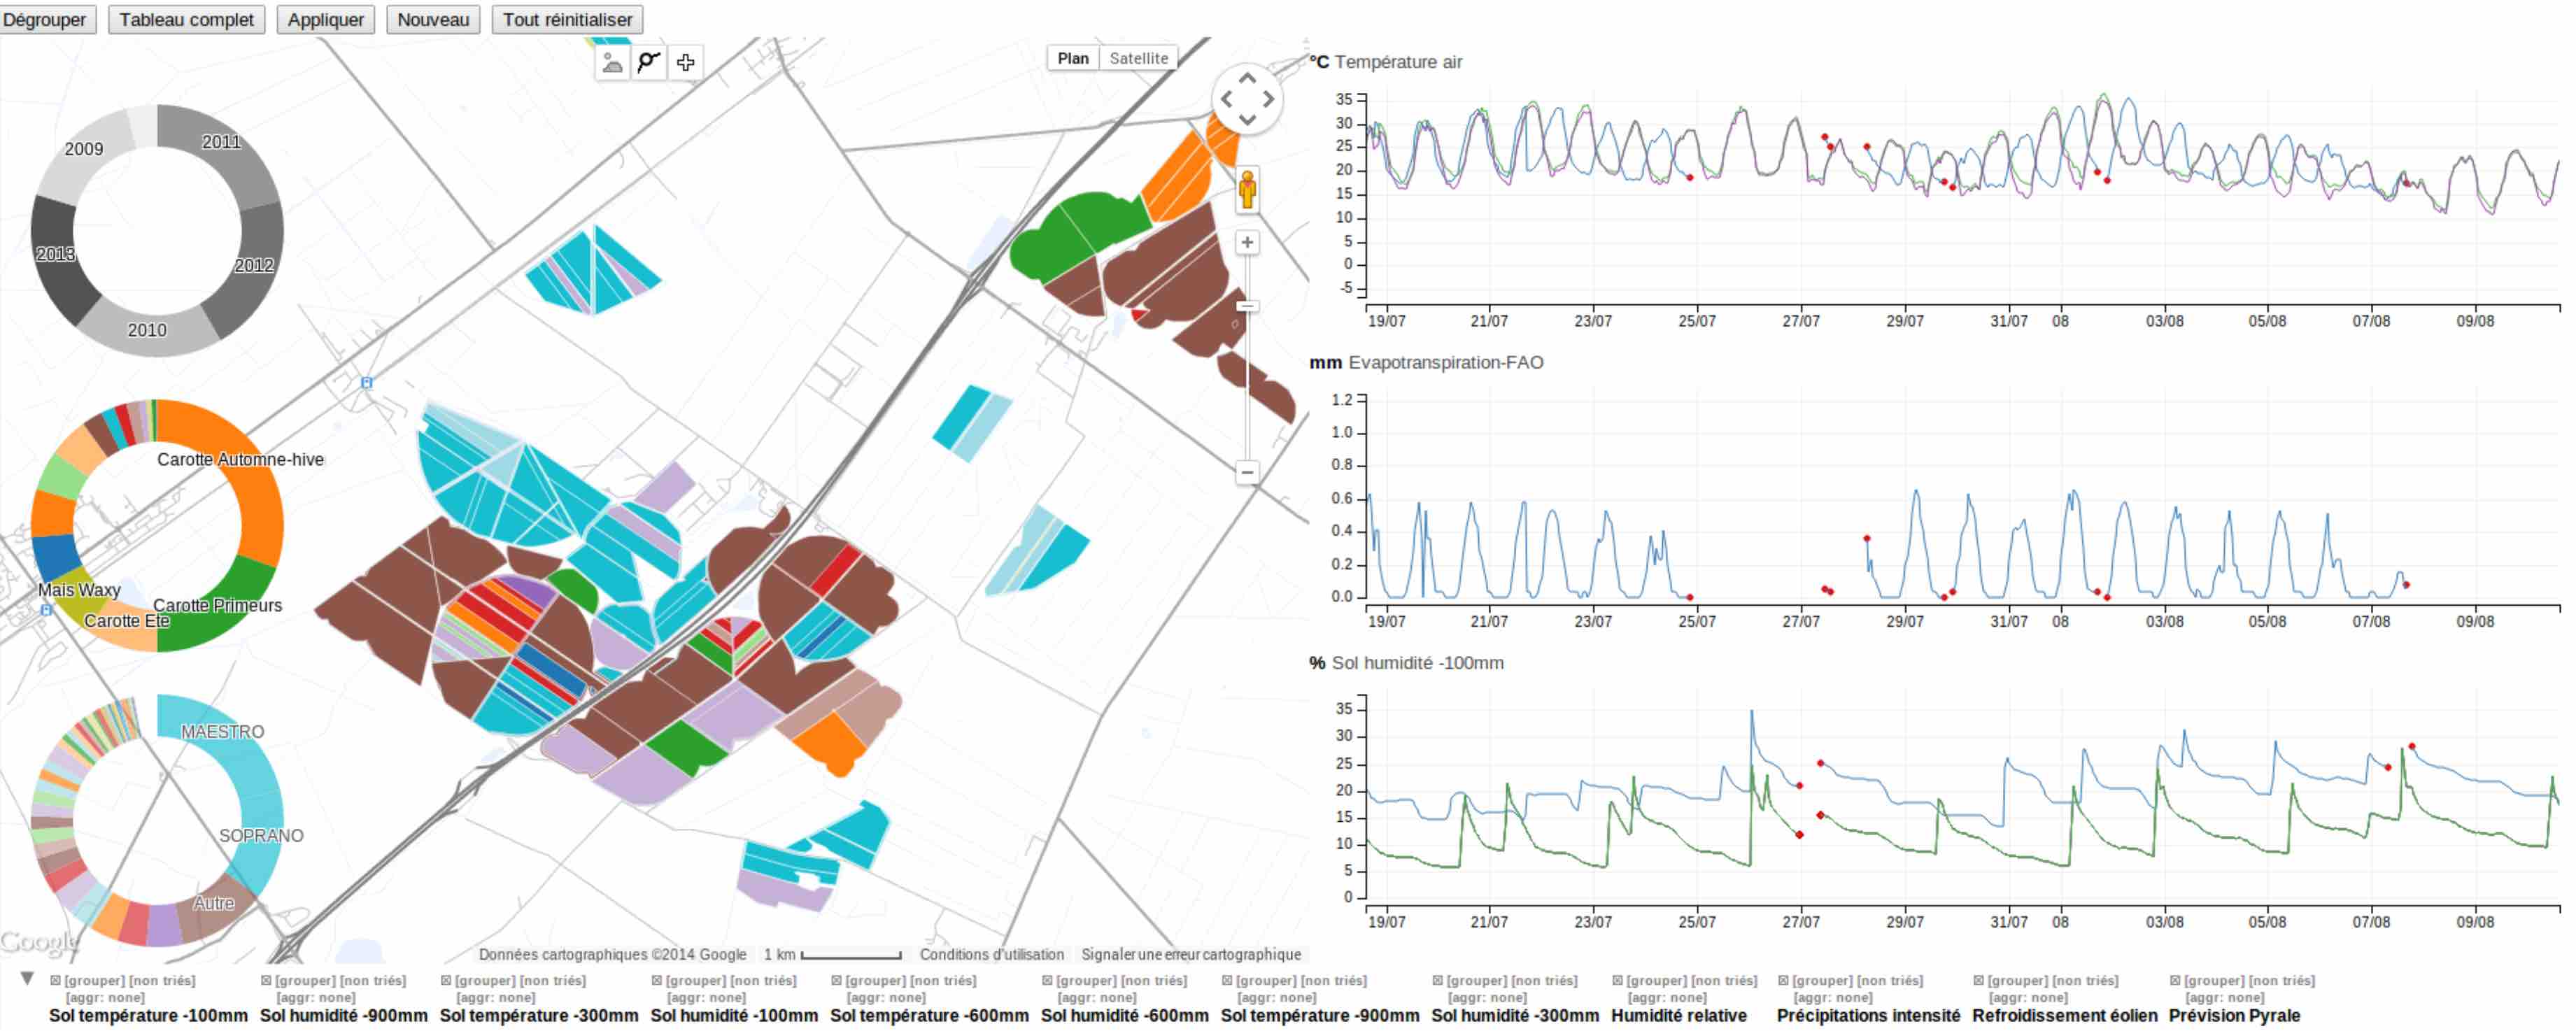
cropplot dashboard
object detection with the Hough transform (to be added)
bl.ocks since 2014