A compact implementation of the squarifying treemap
elastic-charts implements the treemap as one of its numerous chart types. It is a new implementation
instead of an existing implementation such as in D3. For example, it uses shared code for layout variations such as
mosaic/marimekko, and conducive to implementing more layout options. Also, it has an upper bound on area distortion so
that padding among boxes can't "eat" entire, small partitions. Often, it's not a core layout algorithm but the
"last mile" of a chart implementation that requires flexibility and work, so creating the layout code from scratch
didn't involve more work than integrating the D3 treemap would have. It's also helpful for learning and teaching.

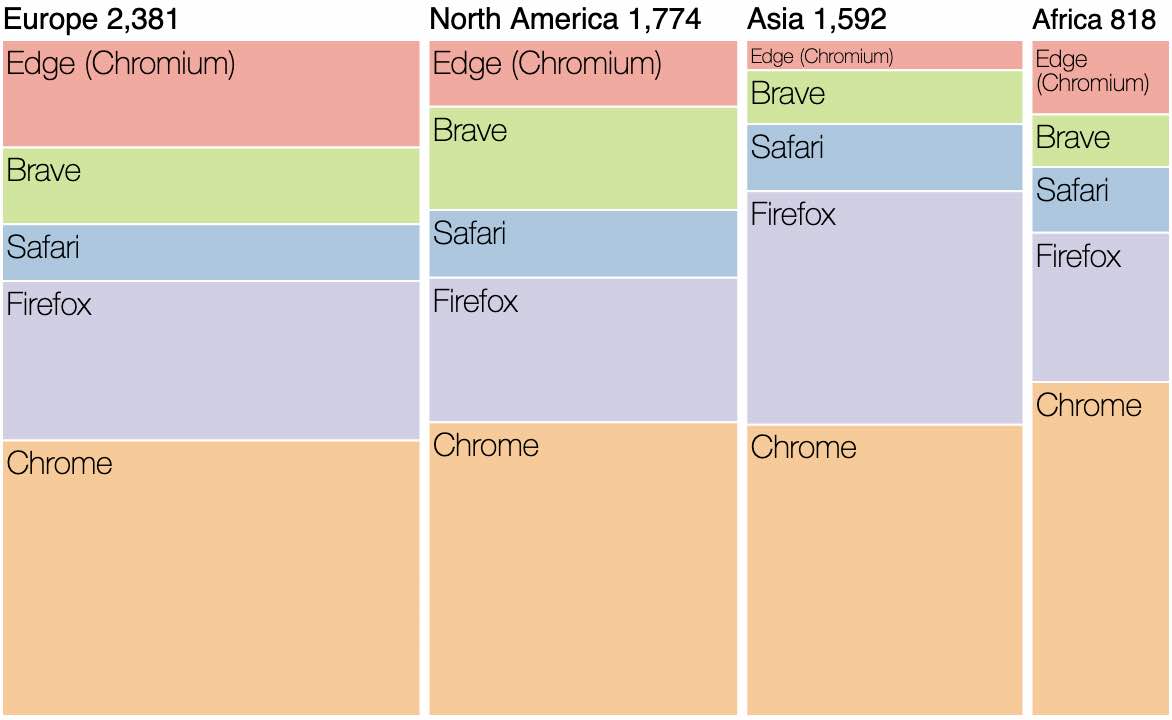
Live Treemap and Mosaic examples in elastic-charts.
Layout implementation
The source code is about 150 lines of JavaScript (type annotated with TypeScript) and currently covers squarifying treemap as well as mosaic/marimekko. It uses a couple of functions with a goal of simplicity and readability.
The basis for implementing it is the paper Squarified Treemap by Bruls, Huizing and van Wijk. Hat tip to Mike Bostock for referencing this paper.
This layout code is found here.
Generally, the layout generation and geometry rendering of a chart is central, yet much of the work relates to labeling, annotations, legend and tooltip.
The text rendering approach is documented here.
The legend and tooltip implementations are created by Marco Vettorello and Nick Partridge, and they merely needed integration and small extensions as they're shared across chart types.
Accessibility layers have been created by Rachel Shen.